Fig. 5.
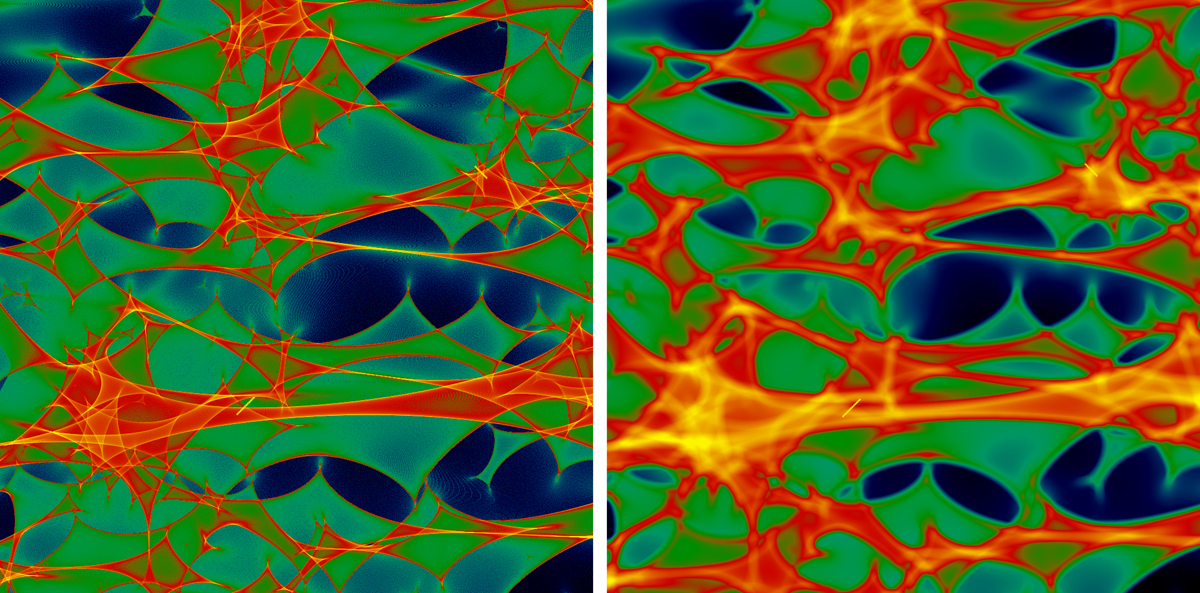
Microlensing magnification patterns for a population of 0.7 M⊙ bodies with parameter values of κ* = 0.39, γ = 0.47 and a point source (left hand panel). Right-hand panel: same simulation but for a source of radius one lt-day. Each frame has a side length of eight Einstein radii in the source plane. The yellow lines indicate tracks across the amplification pattern for the lengths of the B − A and C − A light curves in Fig. 2. A net transverse velocity of 600 km s−1 is assumed (Kayser et al. 1986).
Current usage metrics show cumulative count of Article Views (full-text article views including HTML views, PDF and ePub downloads, according to the available data) and Abstracts Views on Vision4Press platform.
Data correspond to usage on the plateform after 2015. The current usage metrics is available 48-96 hours after online publication and is updated daily on week days.
Initial download of the metrics may take a while.