Fig. 4
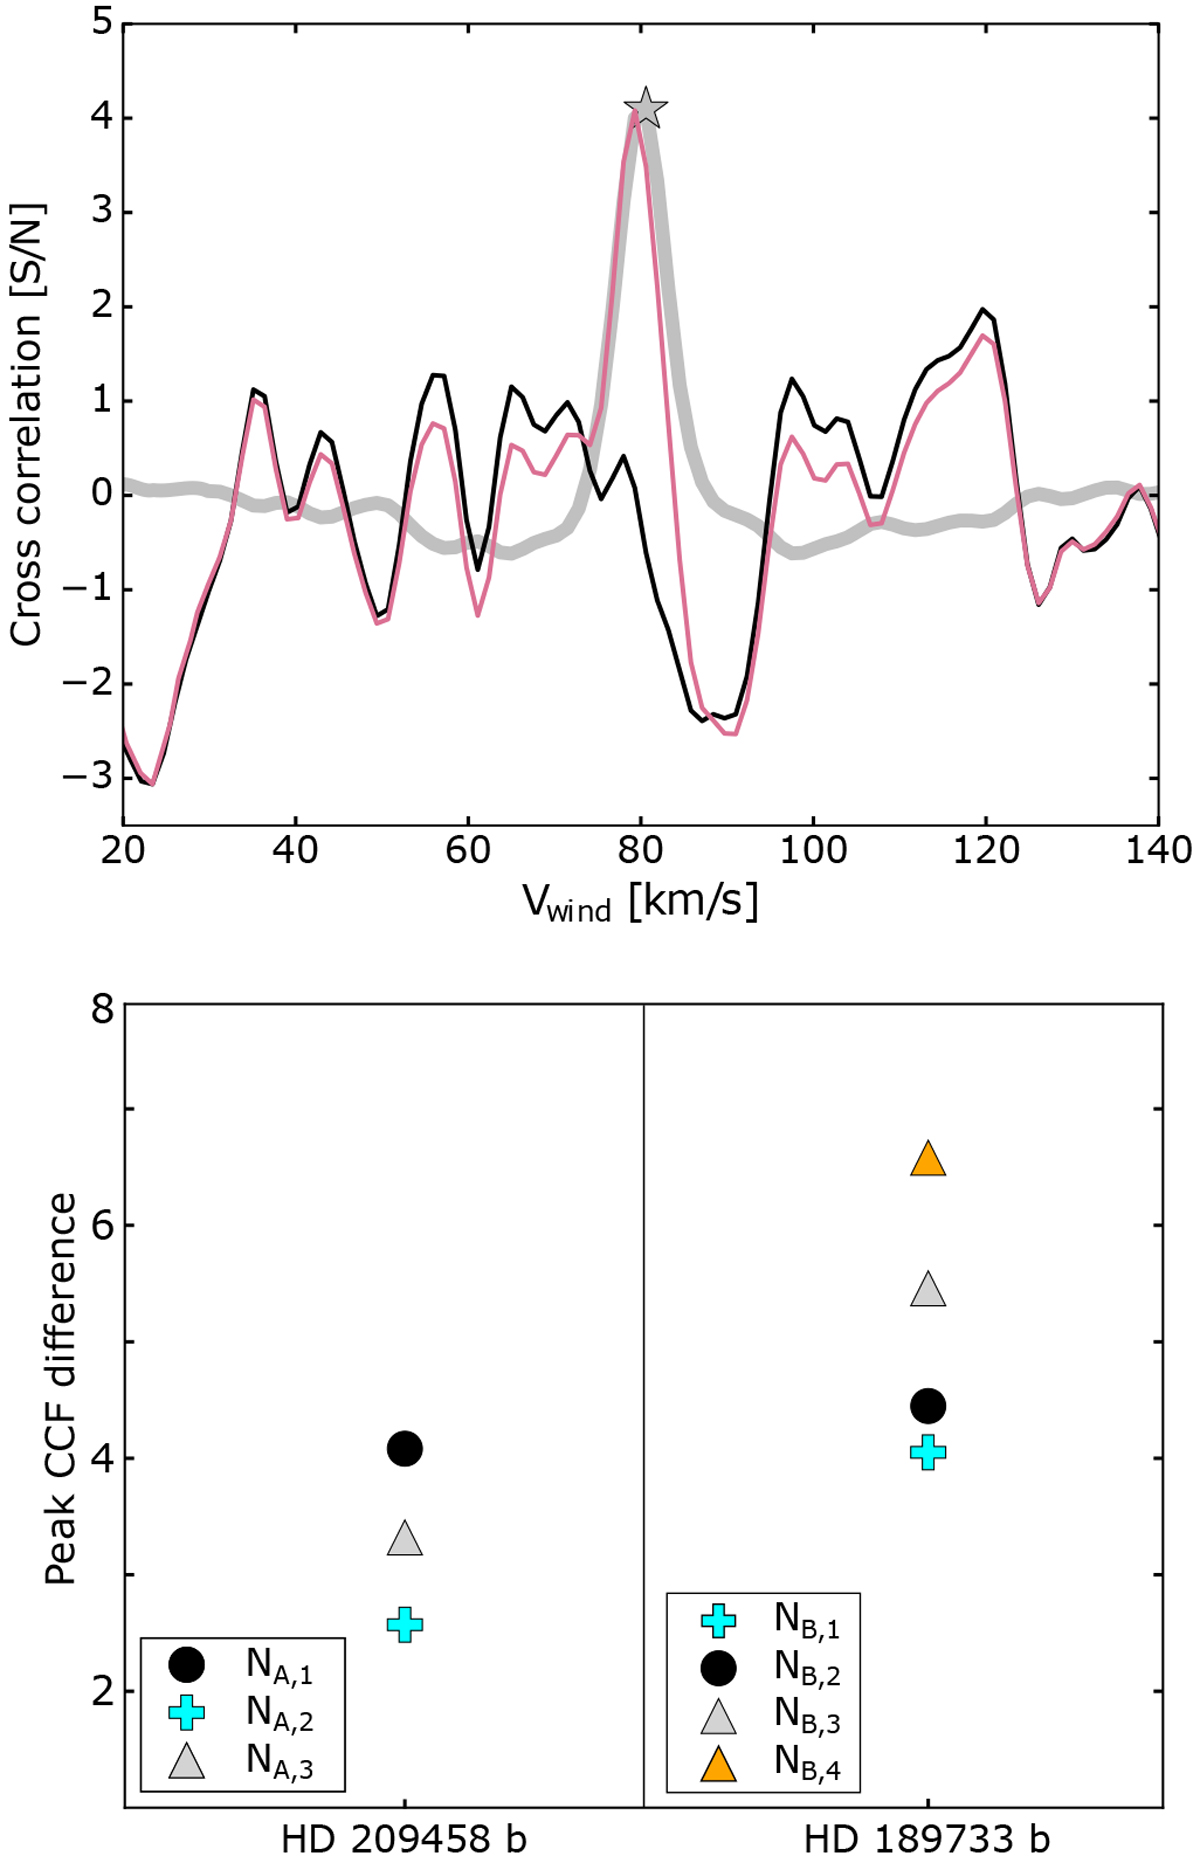
Top: representative CCF obtained with an injected signal at the expected level (magenta) and without an injection (black) at a Kp of 180 km s−1 and vwind = 80.6 km s−1. The difference between both CCFs is shown in grey and its peak is marked with a star symbol. The illustration corresponds to the results of NA, 1. The CCFs for the other nights have similar shapes, but different peak values. Bottom: Peak differences between the CCFs with and without an injection for all HD 209458 b (left) and HD 189733 b (right) data sets.
Current usage metrics show cumulative count of Article Views (full-text article views including HTML views, PDF and ePub downloads, according to the available data) and Abstracts Views on Vision4Press platform.
Data correspond to usage on the plateform after 2015. The current usage metrics is available 48-96 hours after online publication and is updated daily on week days.
Initial download of the metrics may take a while.