Fig. 3
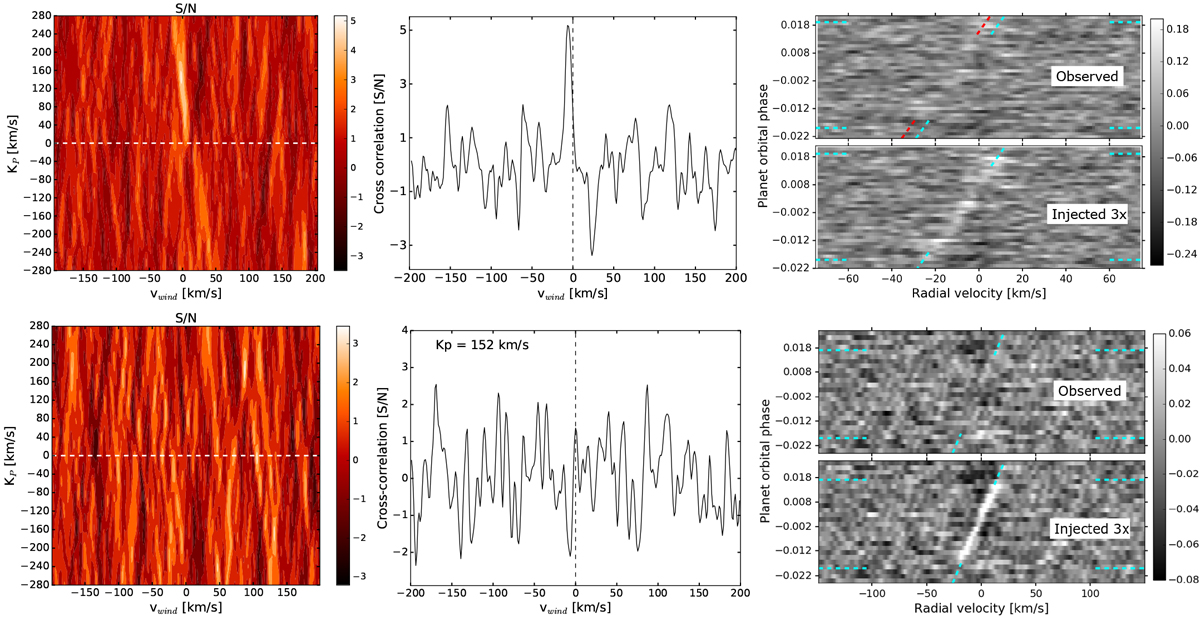
Cross-correlation results obtained on the night NA, 1 for HD 209458 b (top row) and after combining four transits of HD 189733 b (bottom row). Left column: S/N maps of potential water vapour signals with respect to the exoplanet rest-frame (horizontal axis) and Kp (vertical axis). Middle column: slice through the left panels at the Kp with the largest significance peak for HD 209458 b (145 km s−1) and at the expected Kp of HD 189733 b. Right column: cross-correlation matrices in the Earth rest-frame for the observed data and after injecting a signal at 3× the expected strength. The transit occurs between the cyan horizontal dashed lines. The cyan tilted dashed lines mark the expected velocities of the exoplanets during the observations. The tilted red dashed line in the case of HD 209458 b marks the position of the most significant signal observed.
Current usage metrics show cumulative count of Article Views (full-text article views including HTML views, PDF and ePub downloads, according to the available data) and Abstracts Views on Vision4Press platform.
Data correspond to usage on the plateform after 2015. The current usage metrics is available 48-96 hours after online publication and is updated daily on week days.
Initial download of the metrics may take a while.