Fig. 2.
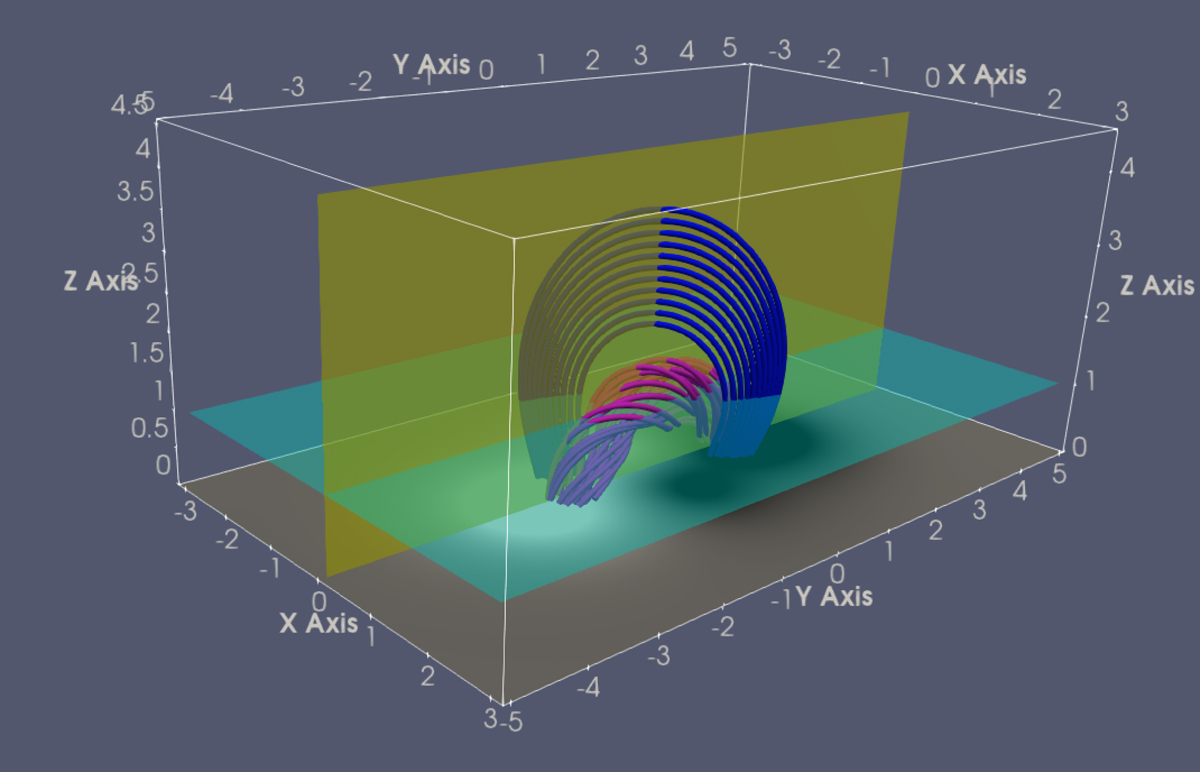
Selected field lines of the TD equilibrium depicting the flux rope (pink) and the surrounding potential field (blue). The two section planes Σ used in Table 1 are the z = 1 plane (cyan) and the x = 0 plane (yellow); see Sect. 5 for details. The distribution of the vertical field component at z = 0 is shown in greyscale at the bottom.
Current usage metrics show cumulative count of Article Views (full-text article views including HTML views, PDF and ePub downloads, according to the available data) and Abstracts Views on Vision4Press platform.
Data correspond to usage on the plateform after 2015. The current usage metrics is available 48-96 hours after online publication and is updated daily on week days.
Initial download of the metrics may take a while.