Fig. 9
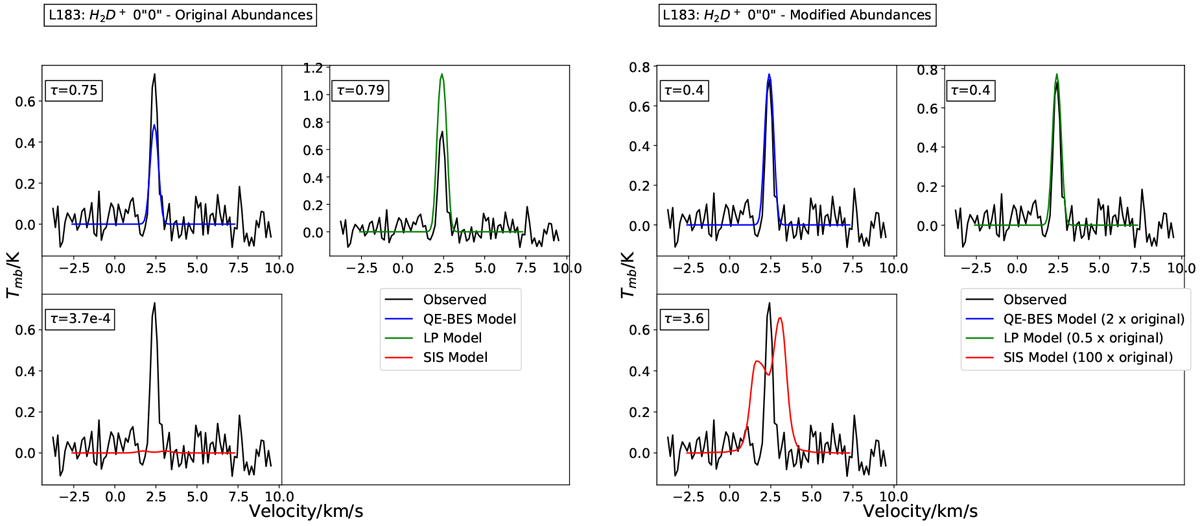
Example of the abundance profile adjustment during the fitting process. The observed line profiles of H2D+ are overplotted with the modeled ones using RATRAN toward the central position of the L183 core. Three different dynamical models were adopted, QE-BES, SIS and LP flow. The original abundance profiles (left panel) were adopted by Pagani et al. (2009) and cannot reproduce the central peak of the observations. Adjusting the H2D+ abundance profile by applying a multiplication factor, resulted in a better reproduction of the observations for the LP and QE-BES models, while the SIS model failed to match the shape of the observed line profile.
Current usage metrics show cumulative count of Article Views (full-text article views including HTML views, PDF and ePub downloads, according to the available data) and Abstracts Views on Vision4Press platform.
Data correspond to usage on the plateform after 2015. The current usage metrics is available 48-96 hours after online publication and is updated daily on week days.
Initial download of the metrics may take a while.