Free Access
Fig. 8
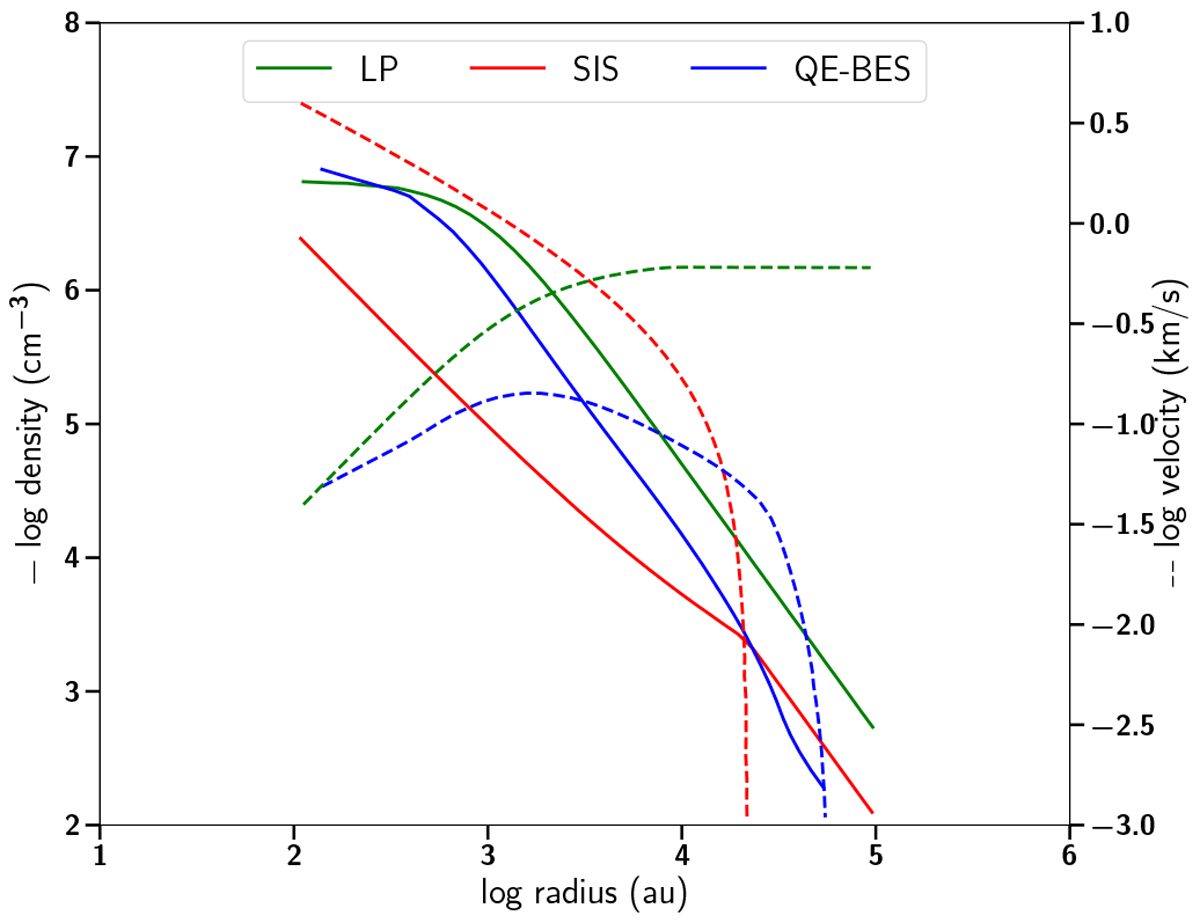
Density (solid line) and velocity (dashed line) profiles of a prestellar core predicted by thethree dynamical models: LP flow (green), SIS (red), and QE-BES (blue), as presented in Keto et al. (2015). Each of the modeled profiles was adopted to model the H2D+ emission using RATRAN.
Current usage metrics show cumulative count of Article Views (full-text article views including HTML views, PDF and ePub downloads, according to the available data) and Abstracts Views on Vision4Press platform.
Data correspond to usage on the plateform after 2015. The current usage metrics is available 48-96 hours after online publication and is updated daily on week days.
Initial download of the metrics may take a while.