Fig. 3
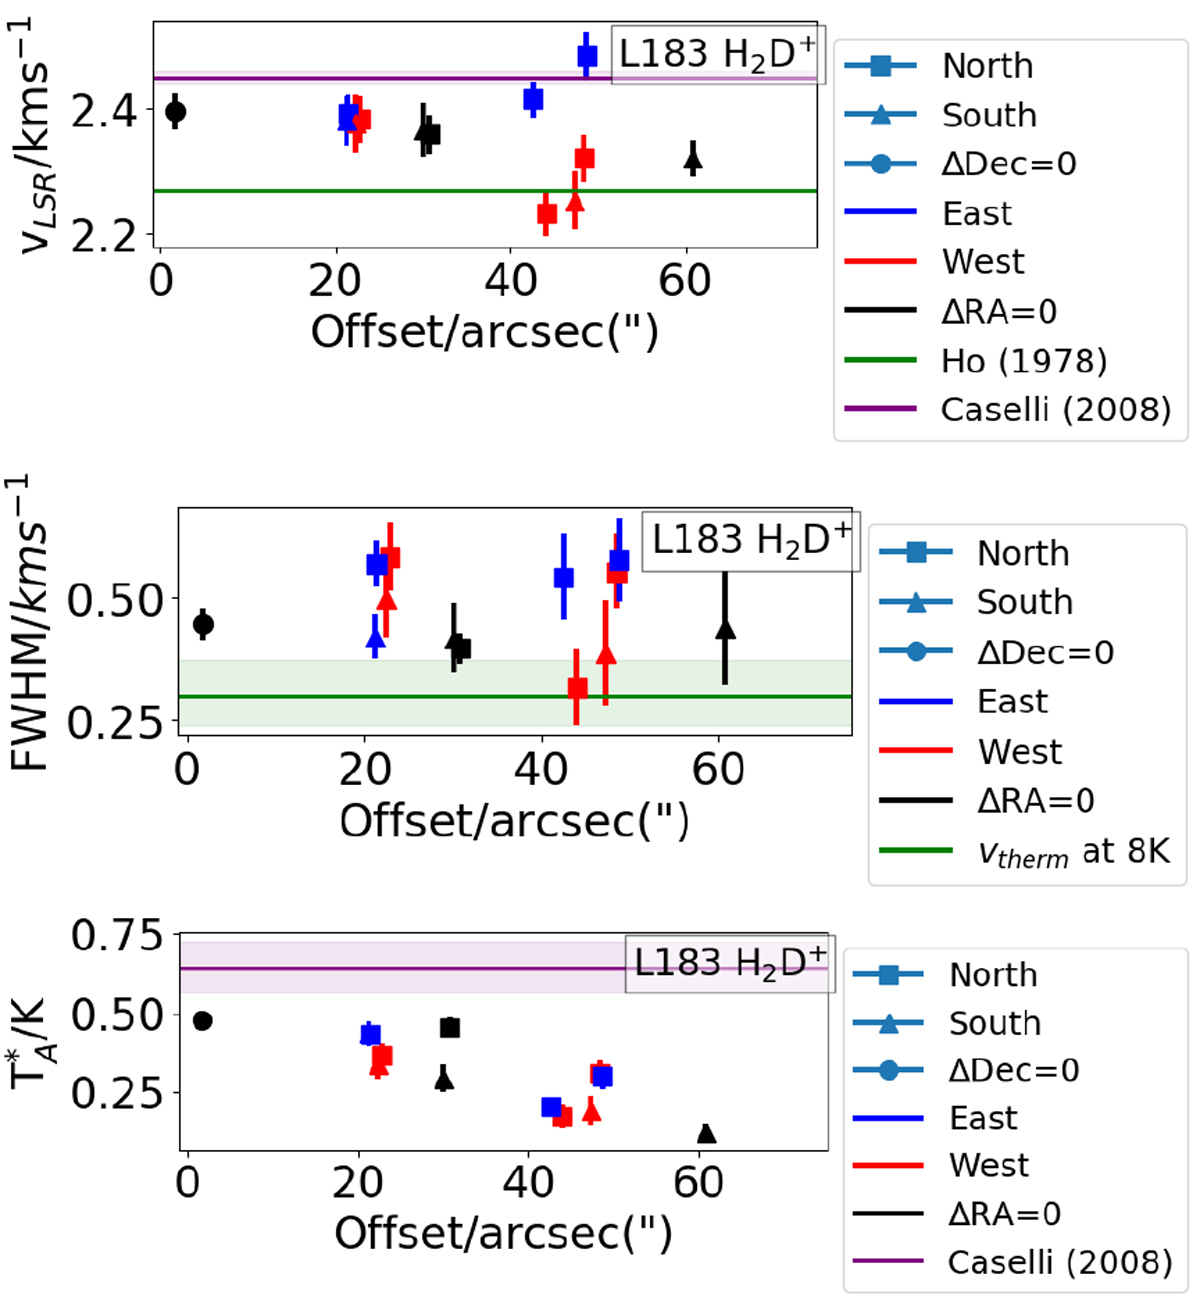
VLSR, FWHM, and![]() measurements of H2D+ plotted over offset from the 850 μm dust peak of L183. The shaded region in the middle plot corresponds to the thermal broadening within the 5–12 K temperature range. The shaded regions in purple correspond to the errors reported in Caselli et al. (2008). The square, triangle, and circle refer to north, south, and 0′′ declination offsets, respectively. The blue and red symbols refer to offsets toward the east and west, respectively, while the black symbols correspond to 0′′ Right Ascension offsets. For example, a 40′′ offset can be represented by a red square (40′′ north-west), a black triangle (40′′ south), a blue circle (40′′ east), and so on.
measurements of H2D+ plotted over offset from the 850 μm dust peak of L183. The shaded region in the middle plot corresponds to the thermal broadening within the 5–12 K temperature range. The shaded regions in purple correspond to the errors reported in Caselli et al. (2008). The square, triangle, and circle refer to north, south, and 0′′ declination offsets, respectively. The blue and red symbols refer to offsets toward the east and west, respectively, while the black symbols correspond to 0′′ Right Ascension offsets. For example, a 40′′ offset can be represented by a red square (40′′ north-west), a black triangle (40′′ south), a blue circle (40′′ east), and so on.
Current usage metrics show cumulative count of Article Views (full-text article views including HTML views, PDF and ePub downloads, according to the available data) and Abstracts Views on Vision4Press platform.
Data correspond to usage on the plateform after 2015. The current usage metrics is available 48-96 hours after online publication and is updated daily on week days.
Initial download of the metrics may take a while.