Fig. 1
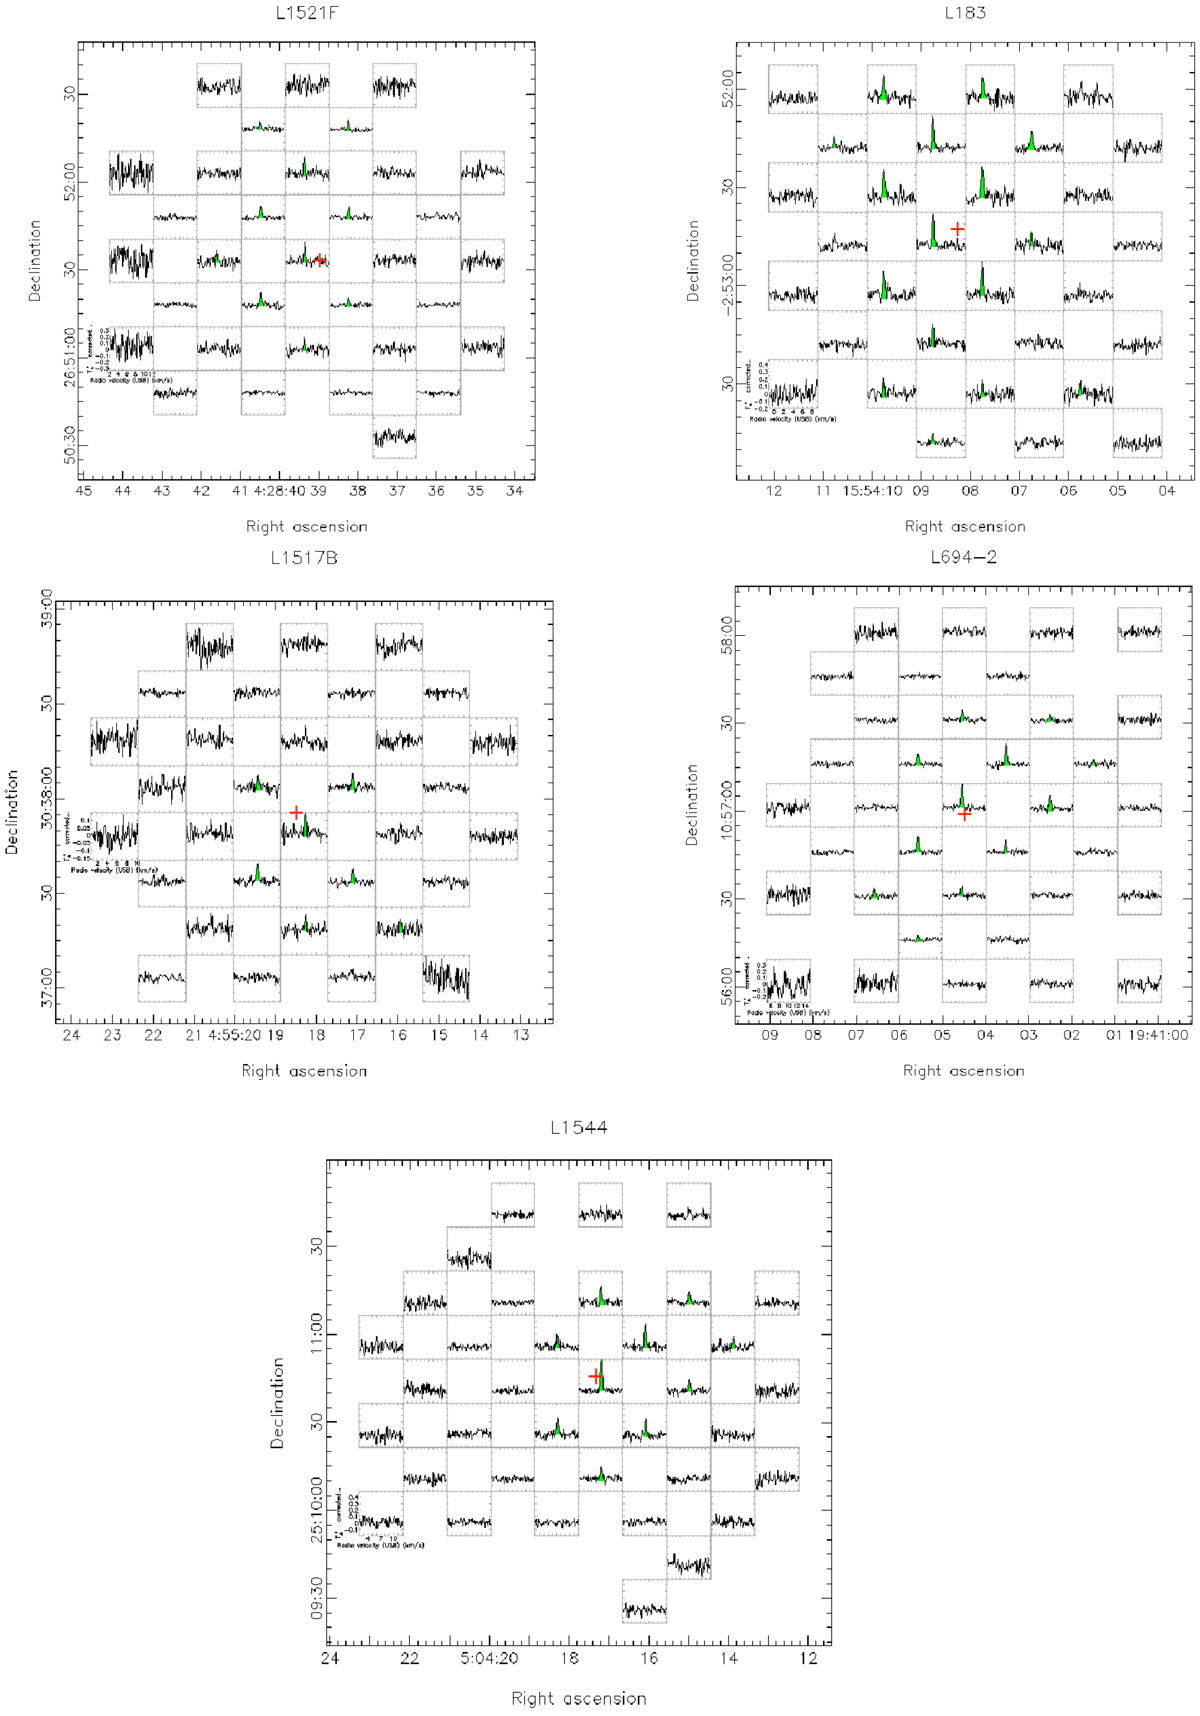
Spatial distribution of H2D+ line emission as observed with JCMT toward the cores L1521f, L183, L1517B, L694-2, and L1544. The red cross indicates the peak of the 850 μm emission. The area filled with light green indicates the clear (>3σ) detections and the possible detections (~2σ) based on the line shape and peak velocity position.
Current usage metrics show cumulative count of Article Views (full-text article views including HTML views, PDF and ePub downloads, according to the available data) and Abstracts Views on Vision4Press platform.
Data correspond to usage on the plateform after 2015. The current usage metrics is available 48-96 hours after online publication and is updated daily on week days.
Initial download of the metrics may take a while.