Free Access
Fig. 3.
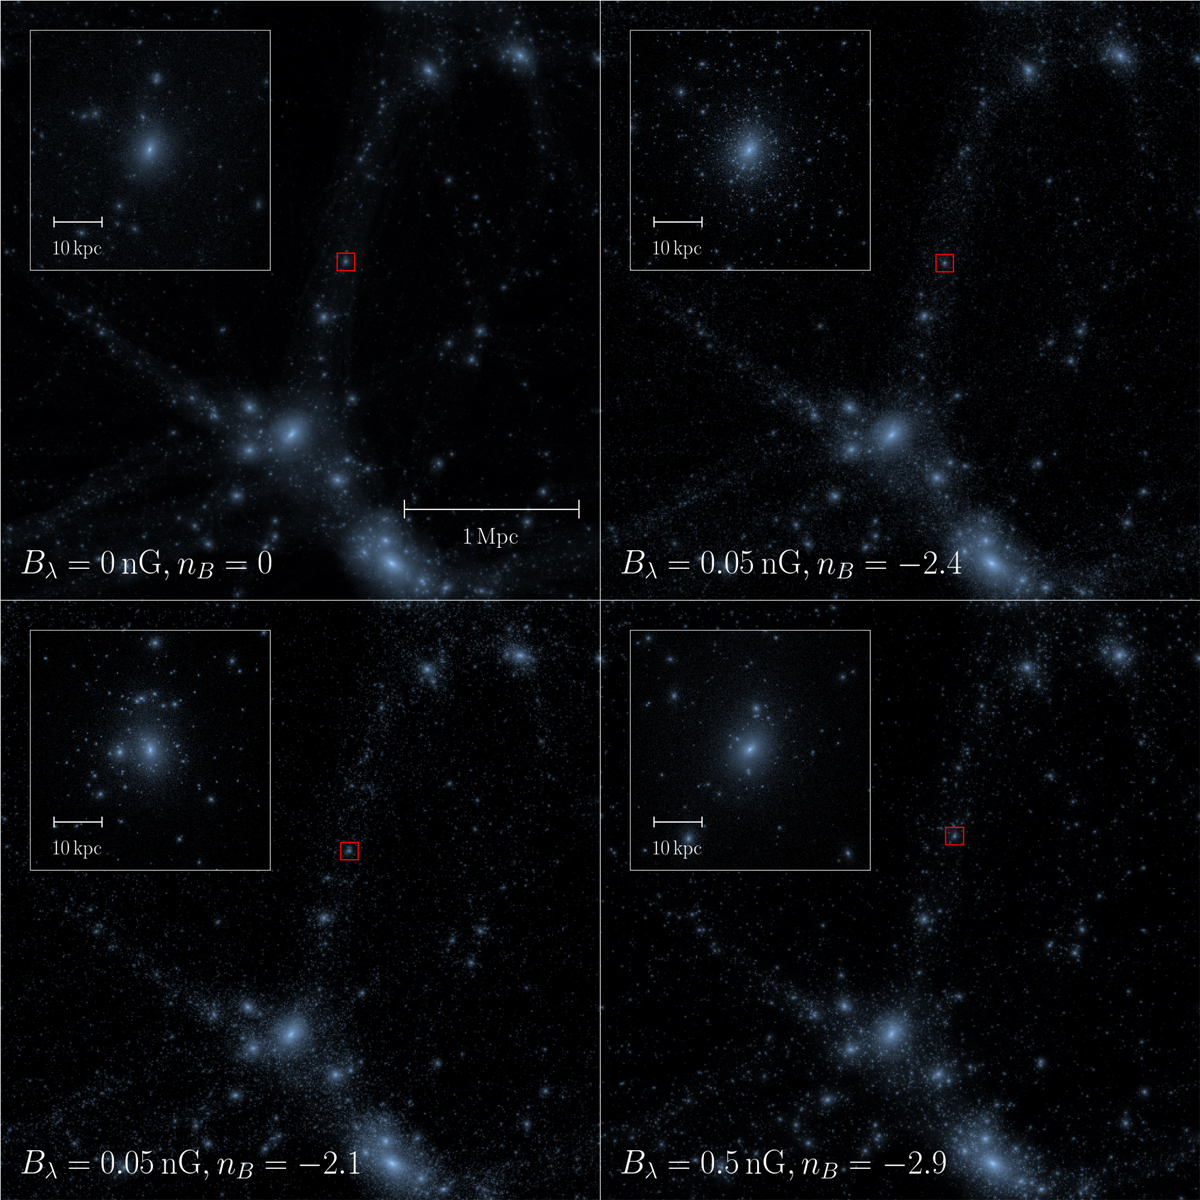
Surface density projections of three DMO simulations at z = 0 with different PMFs, as indicated at the bottom of each panel. Each plot shows the full box; the inset shows a magnification of the dwarf indicated by the red square.
Current usage metrics show cumulative count of Article Views (full-text article views including HTML views, PDF and ePub downloads, according to the available data) and Abstracts Views on Vision4Press platform.
Data correspond to usage on the plateform after 2015. The current usage metrics is available 48-96 hours after online publication and is updated daily on week days.
Initial download of the metrics may take a while.