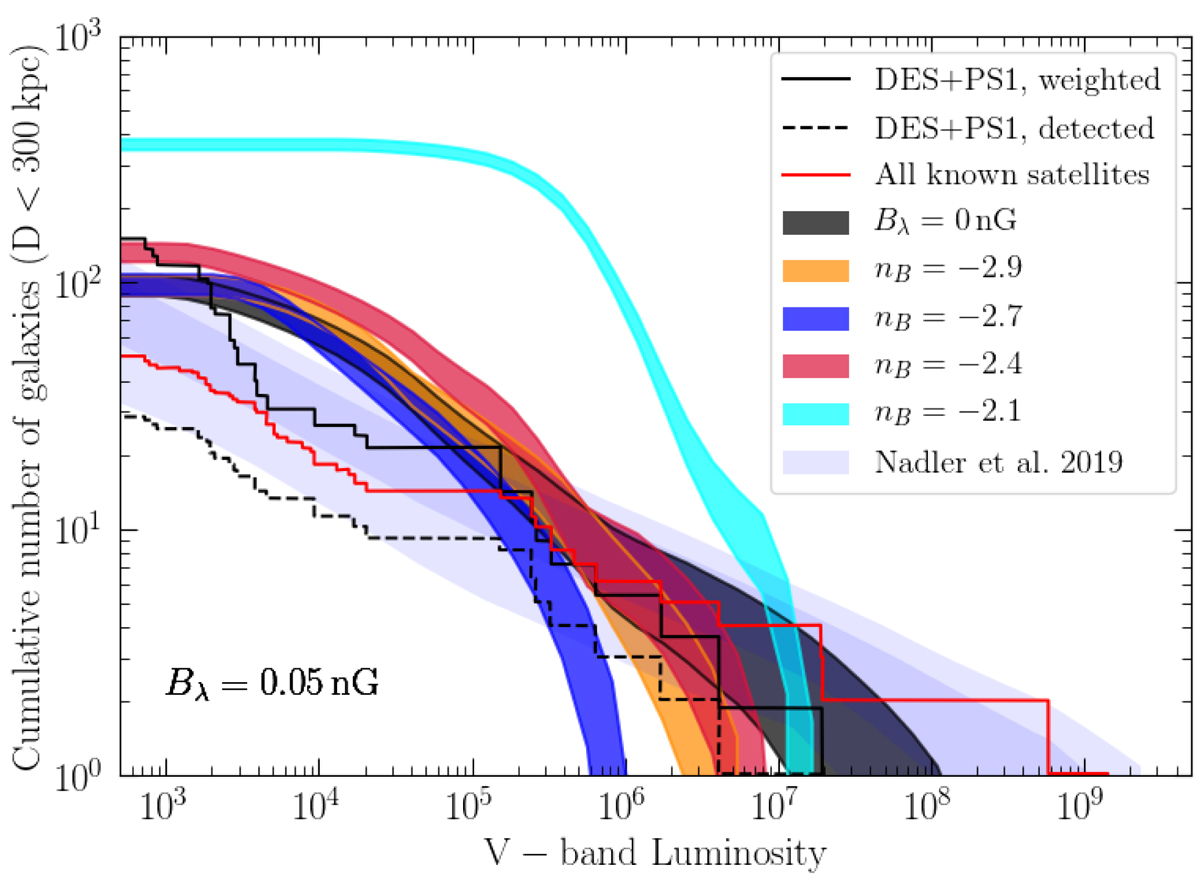
Fig. 19.

Predicted cumulative number of satellites brighter than a given luminosity, within 300 kpc around the Milky Way, for models with different slope indexes nB. For each model the shaded area corresponds to the mean of thousand realizations of dark matter halos plus or minus one standard deviation. Our predictions are compared to the known satellites shown by the red curve. The dashed black line shows detected satellites in the Dark Energy Survey (DES) and Pan-STARRS1 (PS1) as presented in Drlica-Wagner et al. (2020). The solid black line shows the same data but volume corrected, assuming satellites are distributed isotropically. The light blue dashed regions show predictions from cosmological simulations combined with semi-analytical prescriptions (Nadler et al. 2019).
Current usage metrics show cumulative count of Article Views (full-text article views including HTML views, PDF and ePub downloads, according to the available data) and Abstracts Views on Vision4Press platform.
Data correspond to usage on the plateform after 2015. The current usage metrics is available 48-96 hours after online publication and is updated daily on week days.
Initial download of the metrics may take a while.


