Fig. 17.
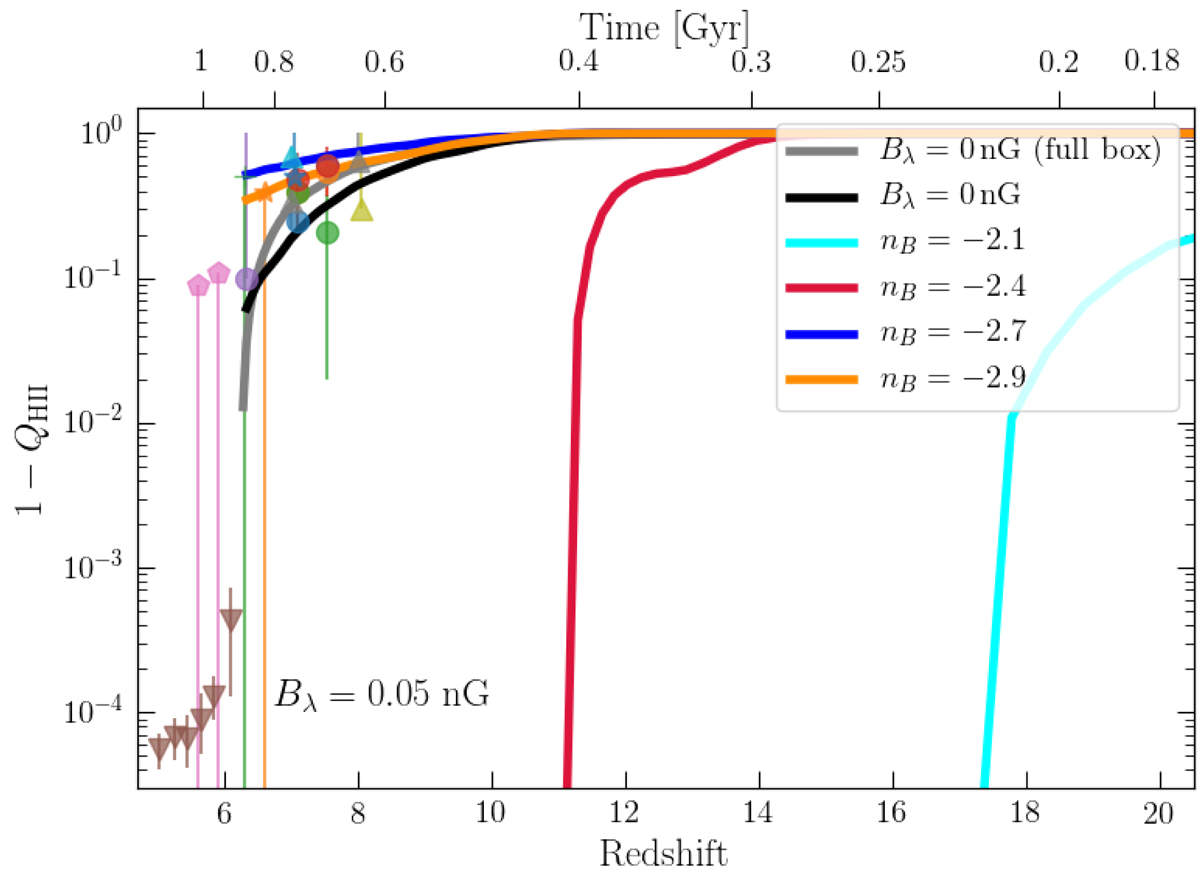
Time evolution of the neutral hydrogen fraction (1 − QHII) for models with different slope indexes nB. The reference simulation (full box) is indicated by the gray curve. The model predictions are compared to observational constraints of the neutral hydrogen fraction from Ly-α absorption of quasars (Fan et al. 2006b) as brown downward triangles; (McGreer et al. 2015) pink pentagons; (Schroeder et al. 2013) purple, (Davies et al. 2018a,b) red, (Greig et al. 2017, 2019) green, (Bañados et al. 2018) orange, and (Durovčíková et al. 2020) blue circles; or gamma-ray bursts (Totani et al. 2006) as a green cross; and by Ly-α emitting galaxies (Ouchi et al. 2010) as an orange star, and (Ono et al. 2012) cyan, (Schenker et al. 2014) gray, and (Tilvi et al. 2014) yellow triangles.
Current usage metrics show cumulative count of Article Views (full-text article views including HTML views, PDF and ePub downloads, according to the available data) and Abstracts Views on Vision4Press platform.
Data correspond to usage on the plateform after 2015. The current usage metrics is available 48-96 hours after online publication and is updated daily on week days.
Initial download of the metrics may take a while.