Fig. 9.
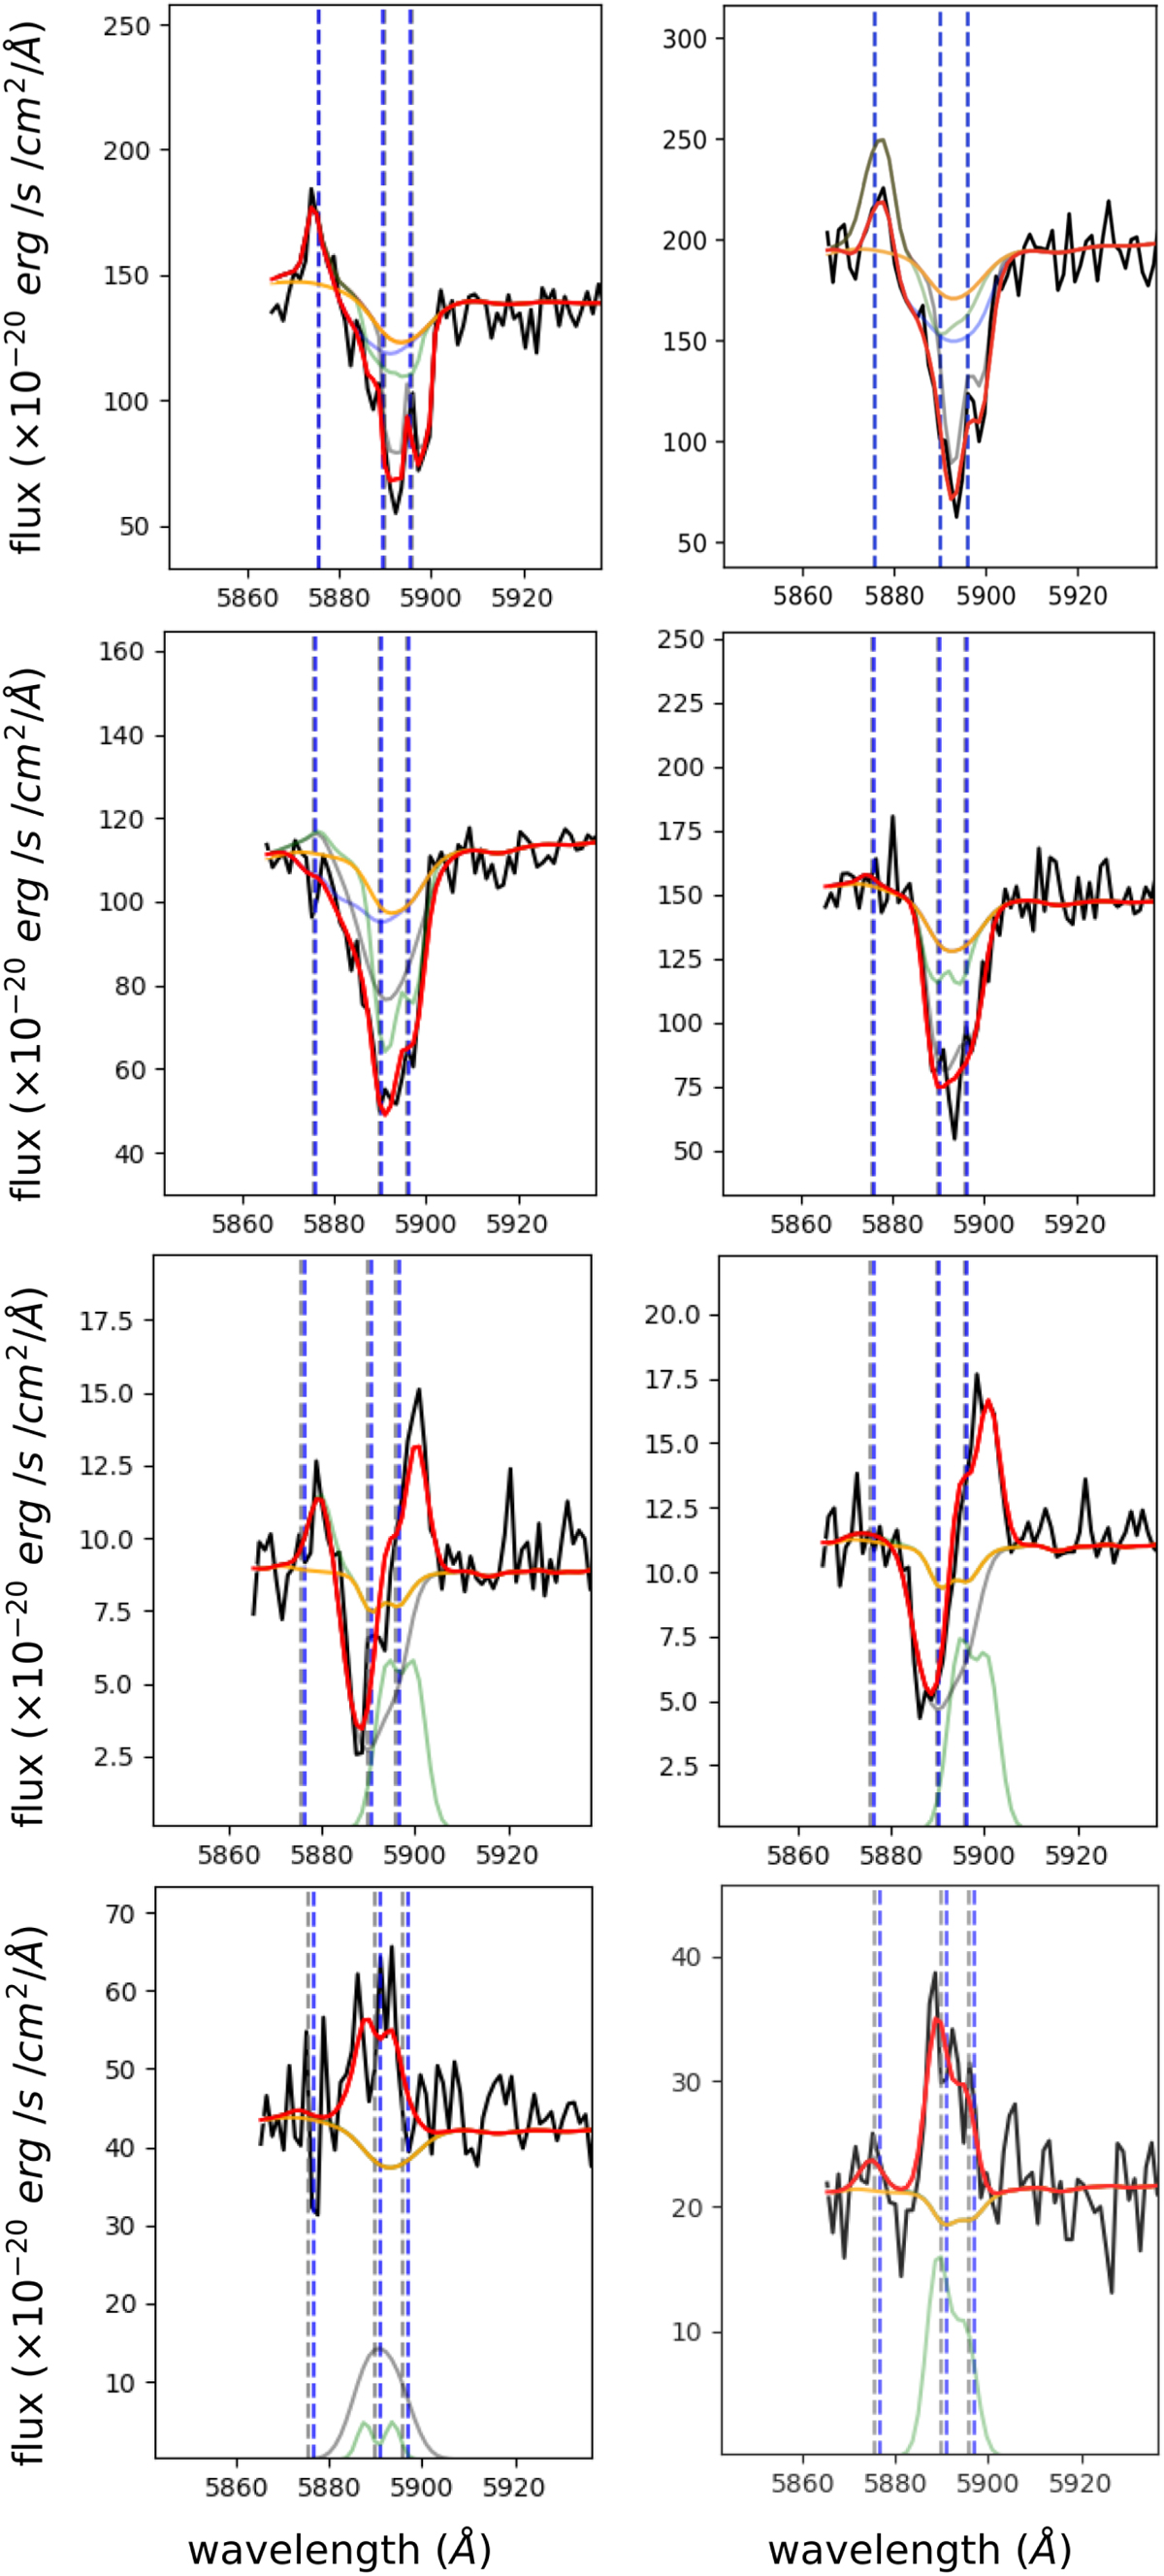
Best-fitting models for eight representative spectra in the vicinity of the Na ID complex. The original spectra are shown in black and the pPXF best-fit models in orange; the red profiles represent the best-fit models obtained with the simultaneous multi-component approach. Green, grey, and blue profiles are obtained from Eq. (1) and represent the different kinematic components used to model the Na ID absorption; in the last four panels, the Na ID emission line contribution (modelled with Gaussian profiles) is shown with an arbitrary offset in the y-axis.
Current usage metrics show cumulative count of Article Views (full-text article views including HTML views, PDF and ePub downloads, according to the available data) and Abstracts Views on Vision4Press platform.
Data correspond to usage on the plateform after 2015. The current usage metrics is available 48-96 hours after online publication and is updated daily on week days.
Initial download of the metrics may take a while.