Fig. 5.
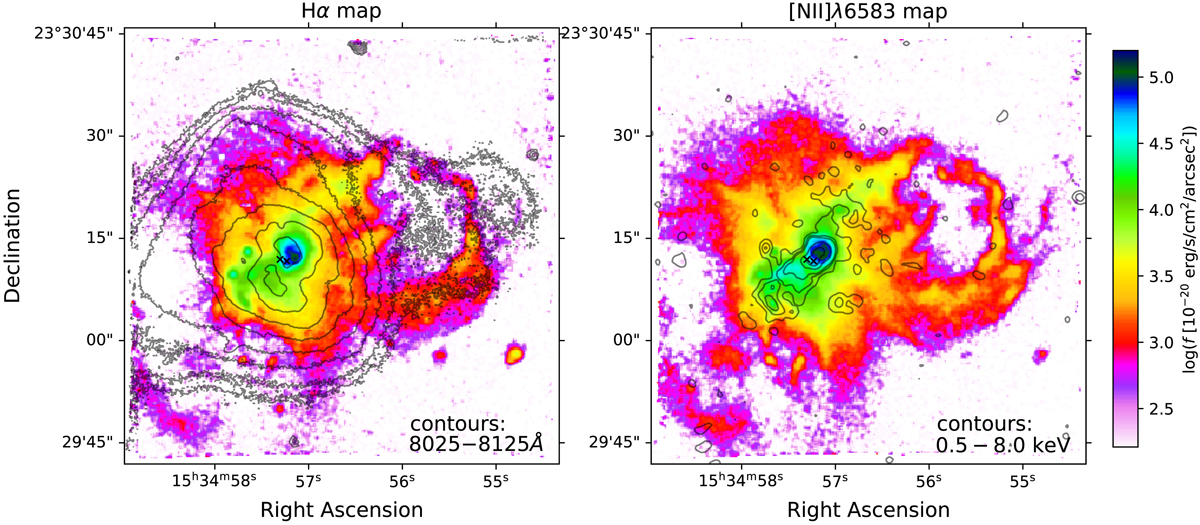
Hα and [N II]λ6583 channel maps obtained by collapsing the ISM data cube on the emission line core (i.e. velocity channels within [−150, +150] km s−1 from the systemic). Contours in the left-hand panel are derived from the continuum emission image shown in Fig. 3, top left; contours in the right-hand panel show the 0.5 − 8 keV emission from Chandra-ACIS observations (OBSID 16092; Paggi et al. 2017).
Current usage metrics show cumulative count of Article Views (full-text article views including HTML views, PDF and ePub downloads, according to the available data) and Abstracts Views on Vision4Press platform.
Data correspond to usage on the plateform after 2015. The current usage metrics is available 48-96 hours after online publication and is updated daily on week days.
Initial download of the metrics may take a while.