Fig. 4.
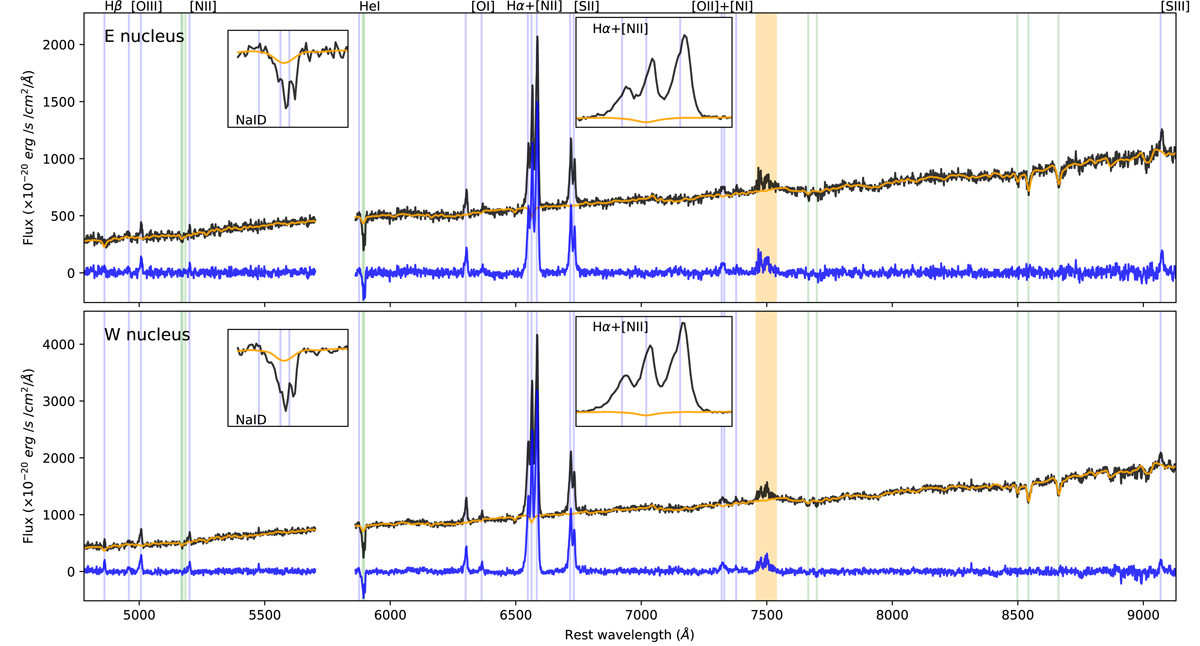
E (top panel) and W (bottom) nucleus spectra (black curves) extracted from 2 × 2 pixel regions. The corresponding pPXF best-fit model profiles are shown with orange curves. The pure emission and absorption ISM spectra (blue curves) are obtained by subtracting the best-fit stellar contribution from the original spectra. The insets show the spectra and stellar models around Na ID and the Hα+[N II] complex. The vertical blue lines mark the wavelengths of the emission lines detected in the two spectra; the green lines mark the position of stellar absorption systems (from left to right: MgI triplet, Na ID and KI doublets, CaII triplet). The regions excluded from the pPXF fits, and corresponding to the most intense sky line residuals, are highlighted as shaded orange areas; the portion of the spectra around 5700 Å is missing because of a filter blocking the laser contamination.
Current usage metrics show cumulative count of Article Views (full-text article views including HTML views, PDF and ePub downloads, according to the available data) and Abstracts Views on Vision4Press platform.
Data correspond to usage on the plateform after 2015. The current usage metrics is available 48-96 hours after online publication and is updated daily on week days.
Initial download of the metrics may take a while.