Fig. E.1.
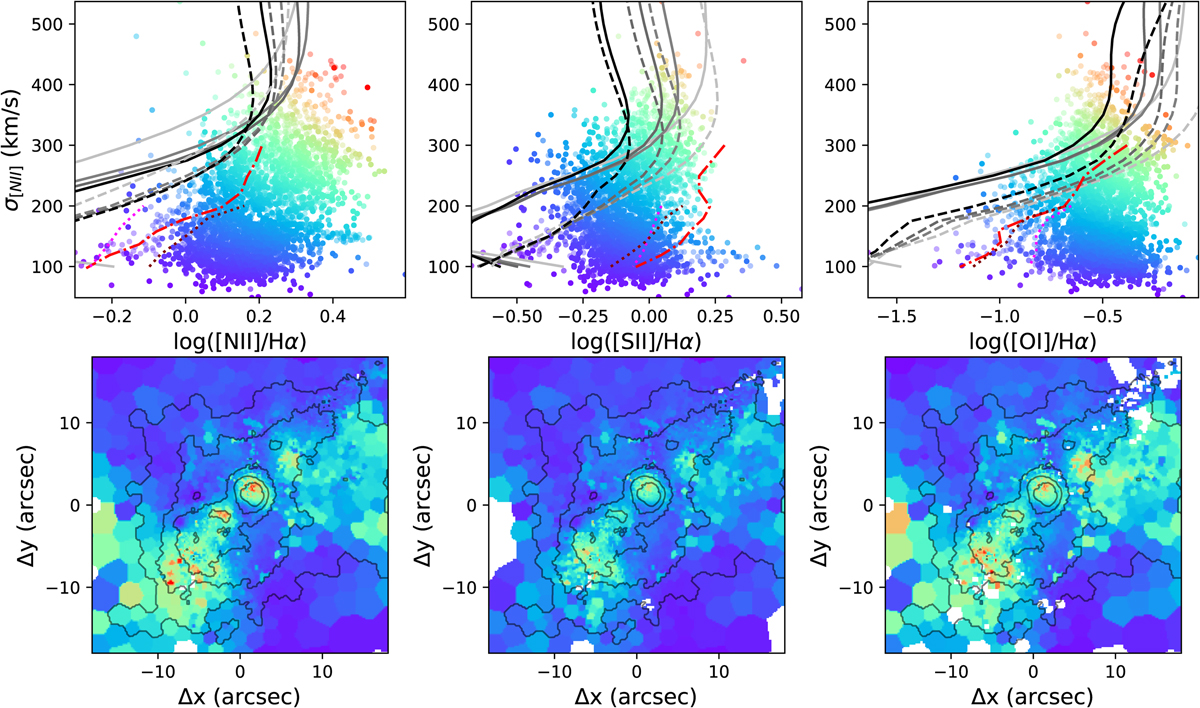
Top panels: σ[NII] against log([N II]/)Hα, log([S II]/)Hα, and log([O I]/)Hα, from left to right, obtained from the fitted total line profiles. The plotted measurements are colour-coded from purple to red, going from low to high flux ratios and line widths. Dashed and solid lines represent shock model grids from MAPPING V (Sutherland & Dopita 2017; Sutherland et al. 2018; see Fig. 16 for details). We assumed a one-to-one correlation between Vs and σ. For comparison, we also display the shock model predictions derived by Ho et al. (2014, dot-dashed red lines) and by Rich et al. (2011, magenta and purple curves, considering an 80% shock fraction); none of these predictions, derived assuming a pre-shock density of 10 cm−3 and different metallicities and magnetic field strengths (see Sect. 6.2.1 in Ho et al. 2014 and Sect. 7.1 in Rich et al. 2011 for details), match the majority of the Arp220 measurements. Bottom panels: Arp220 maps associated with the top panel diagrams, using the same colour codes.
Current usage metrics show cumulative count of Article Views (full-text article views including HTML views, PDF and ePub downloads, according to the available data) and Abstracts Views on Vision4Press platform.
Data correspond to usage on the plateform after 2015. The current usage metrics is available 48-96 hours after online publication and is updated daily on week days.
Initial download of the metrics may take a while.