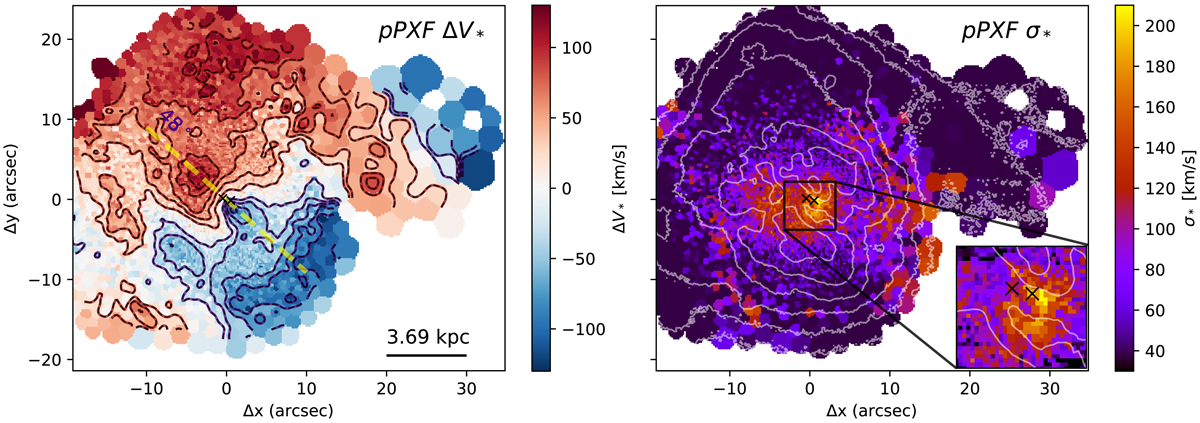
Fig. 3.

Arp220 stellar kinematic maps from our pPXF analysis. The contours in the left-hand panel show the negative (dark blue) and positive (dark red) isovelocity curves, from −100 to +100 km s−1, equally spaced in steps of 20 km s−1; the contours in the right-hand panel are derived from the continuum emission image shown in Fig. 2 (top left) and are equally spaced in steps of 0.25 dex, starting from 1.3 × 10⁻¹⁶ erg s−1 cm−2 arcsec−2. The crosses mark the two nuclei; the dashed yellow line in the left-hand panel shows PA = 48°, corresponding to the major axis of Arp220. Right-hand panel: the inset shows a zoomed-in view of the innermost nuclear regions, highlighting the ring-like shape with high σ* values (using a slightly different colour bar); the positions of the two nuclei are shown with black crosses. Stellar velocity dispersions are not corrected for the instrumental broadening. North is up.
Current usage metrics show cumulative count of Article Views (full-text article views including HTML views, PDF and ePub downloads, according to the available data) and Abstracts Views on Vision4Press platform.
Data correspond to usage on the plateform after 2015. The current usage metrics is available 48-96 hours after online publication and is updated daily on week days.
Initial download of the metrics may take a while.


