Free Access
Fig. C.2.
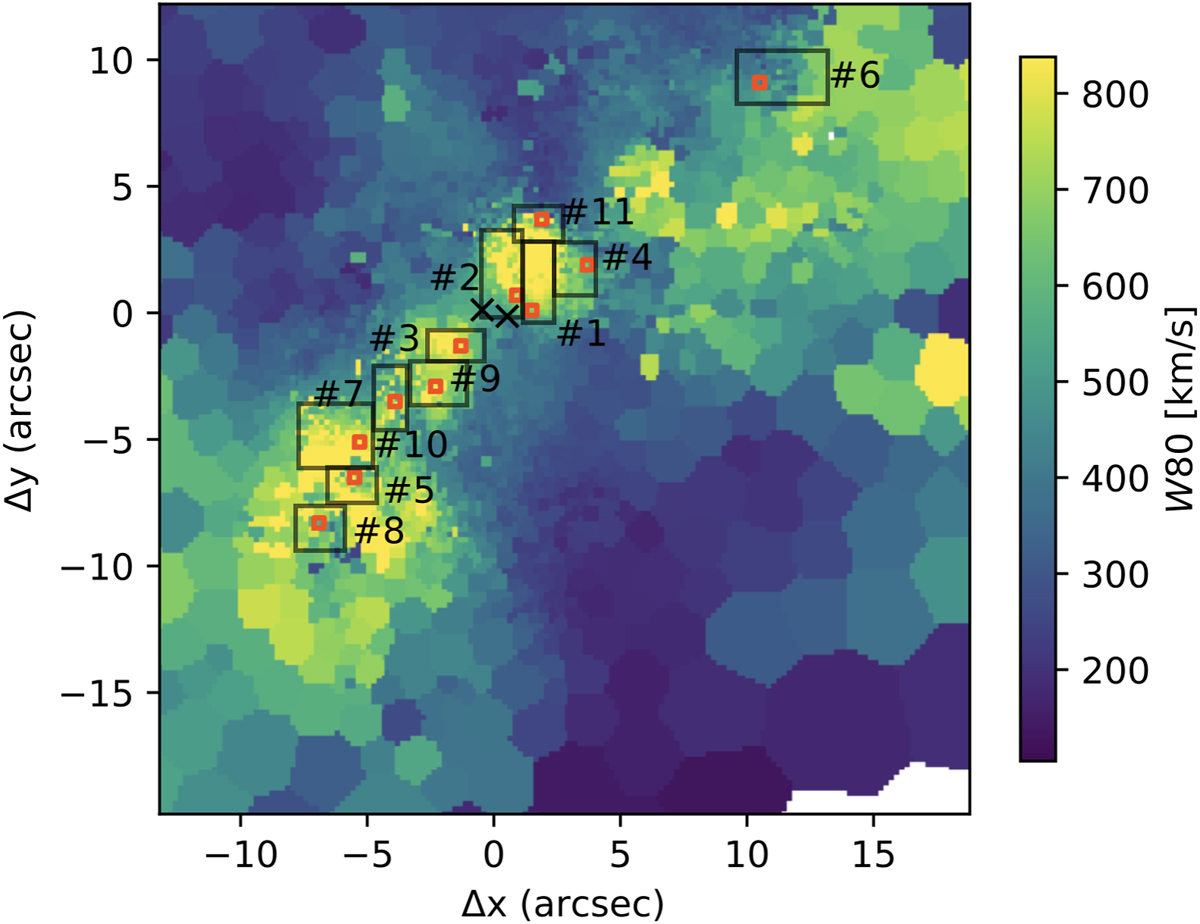
Arp220 W80 map showing, with red squares, the location of the 2 × 2 pixel spectra reported in Fig. C.1. The spatial extent of the associated regions with well-determined kinematics are sketched with black squares.
Current usage metrics show cumulative count of Article Views (full-text article views including HTML views, PDF and ePub downloads, according to the available data) and Abstracts Views on Vision4Press platform.
Data correspond to usage on the plateform after 2015. The current usage metrics is available 48-96 hours after online publication and is updated daily on week days.
Initial download of the metrics may take a while.