Fig. A.2.
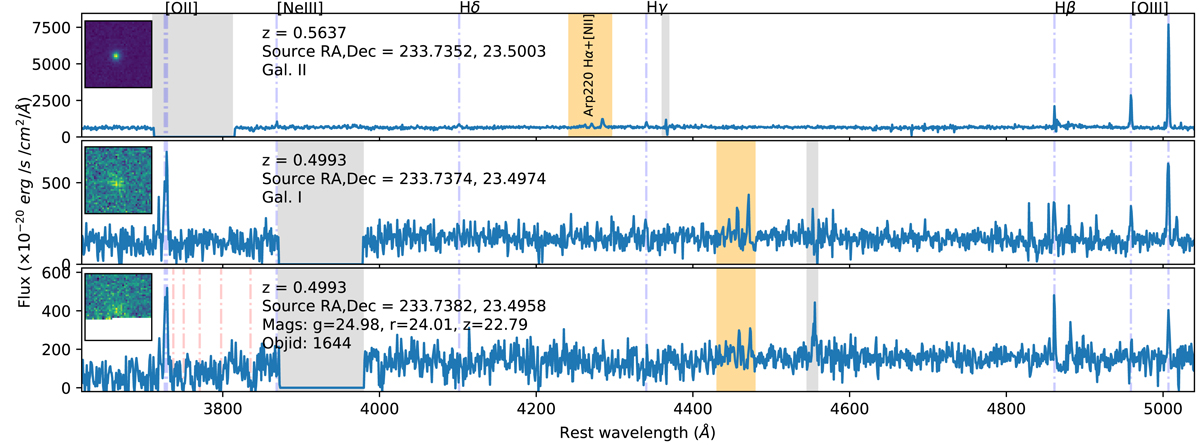
Spectra extracted from circular apertures (r = 0.6″) centred on the sources shown in the top-left insets. The shaded orange regions highlight the Hα+[N II] system associated with Arp220; the grey regions mark the channels with strong contamination caused by Na lasers. The vertical blue lines mark the brightest emission lines; in the bottom panel, Balmer and CaII absorption features around 3800 Å are marked with red lines. For each source, we report the spectroscopic redshift, the coordinates, and, for the sources in the DECaLS Survey (Dey et al. 2018), the optical magnitudes. The insets show the [O III] (for the first source) and [OII] emission maps for each source.
Current usage metrics show cumulative count of Article Views (full-text article views including HTML views, PDF and ePub downloads, according to the available data) and Abstracts Views on Vision4Press platform.
Data correspond to usage on the plateform after 2015. The current usage metrics is available 48-96 hours after online publication and is updated daily on week days.
Initial download of the metrics may take a while.