Fig. 20.
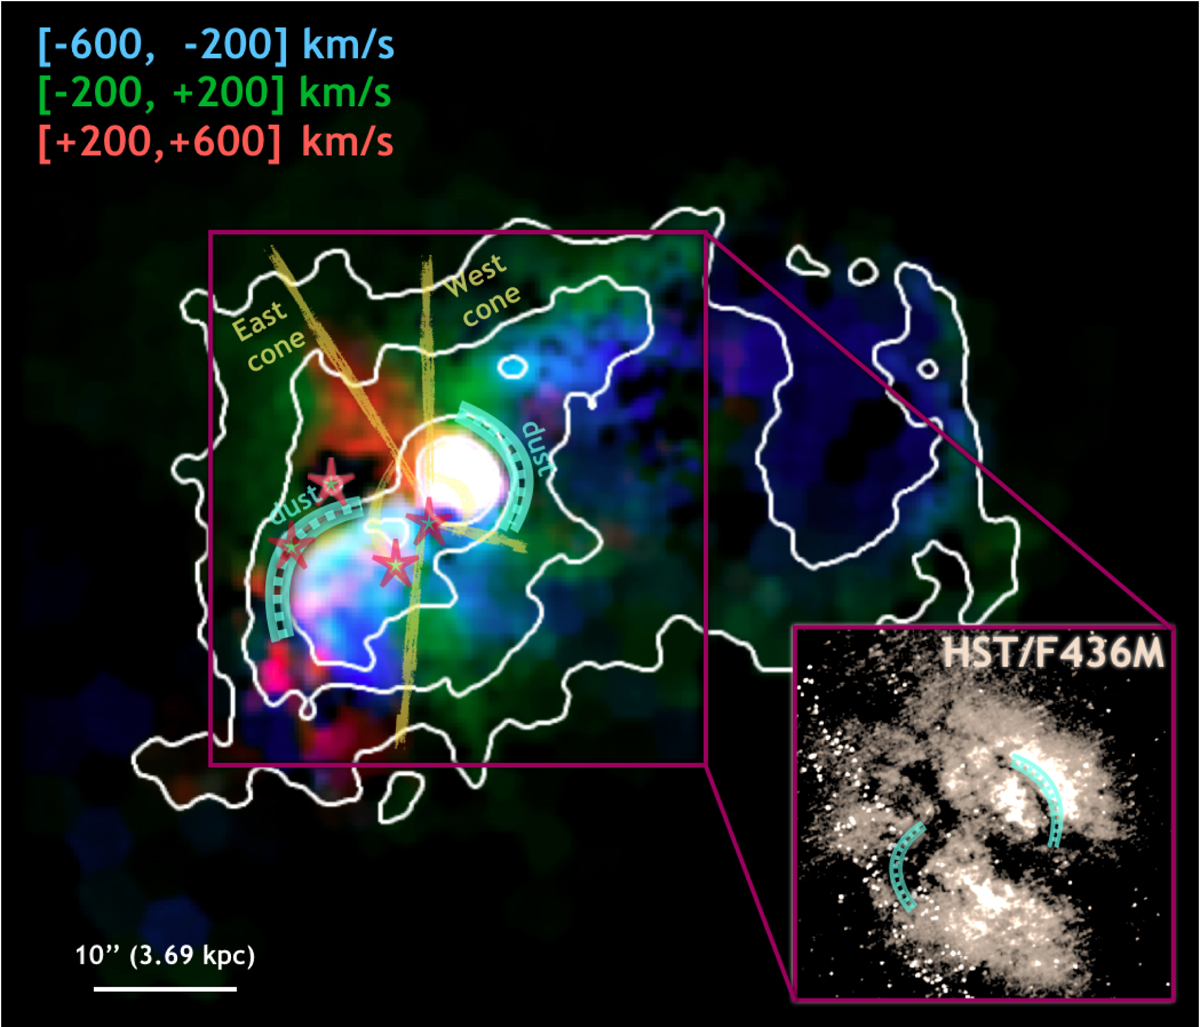
Schematic view of the main structures in Arp220, revealed by MUSE. The three-colour image shows the [N II] shock emission, reconstructed from multi-component best-fit results. Superimposed yellow lines highlight the biconical outflow. Star symbols identify the four main SCs identified in Sect. 10. Cyan curves locate the main dust filaments possibly affecting the outflow geometry. The same curves are reported in the inset, showing the blue stellar continuum emission as well as the dusty structures in the innermost nuclear regions of Arp220.
Current usage metrics show cumulative count of Article Views (full-text article views including HTML views, PDF and ePub downloads, according to the available data) and Abstracts Views on Vision4Press platform.
Data correspond to usage on the plateform after 2015. The current usage metrics is available 48-96 hours after online publication and is updated daily on week days.
Initial download of the metrics may take a while.