Fig. 18.
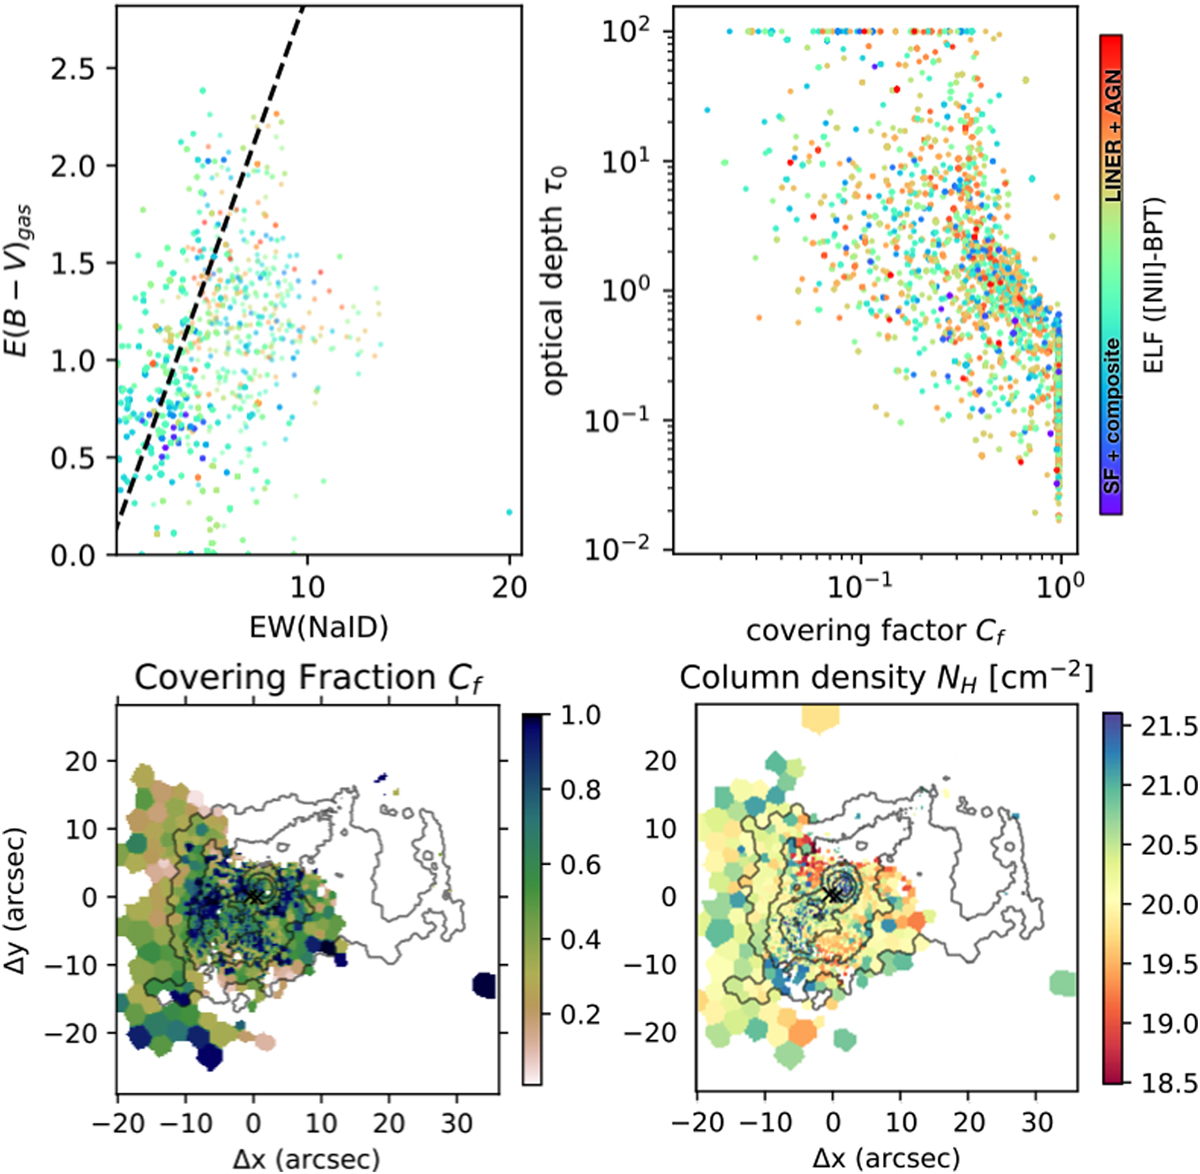
Top left: E(B − V)gas as a function of the Na ID EW. The dashed line represents Eq. (4), derived under the assumption that both quantities are proportional to the hydrogen column density NH. Top right: covering factor vs. optical depth for each kinematic component used to model the Na ID profiles. The points in the top panels are colour-coded according to their position in the [N II]-BPT diagram (Fig. 14, top right). Bottom left: covering factor map, obtained from the total Na ID profiles following the Rupke et al. (2005a) prescription. Bottom right: column density map, obtained by summing the NH derived from each kinematic component required to model Na ID profiles.
Current usage metrics show cumulative count of Article Views (full-text article views including HTML views, PDF and ePub downloads, according to the available data) and Abstracts Views on Vision4Press platform.
Data correspond to usage on the plateform after 2015. The current usage metrics is available 48-96 hours after online publication and is updated daily on week days.
Initial download of the metrics may take a while.