Fig. 17.
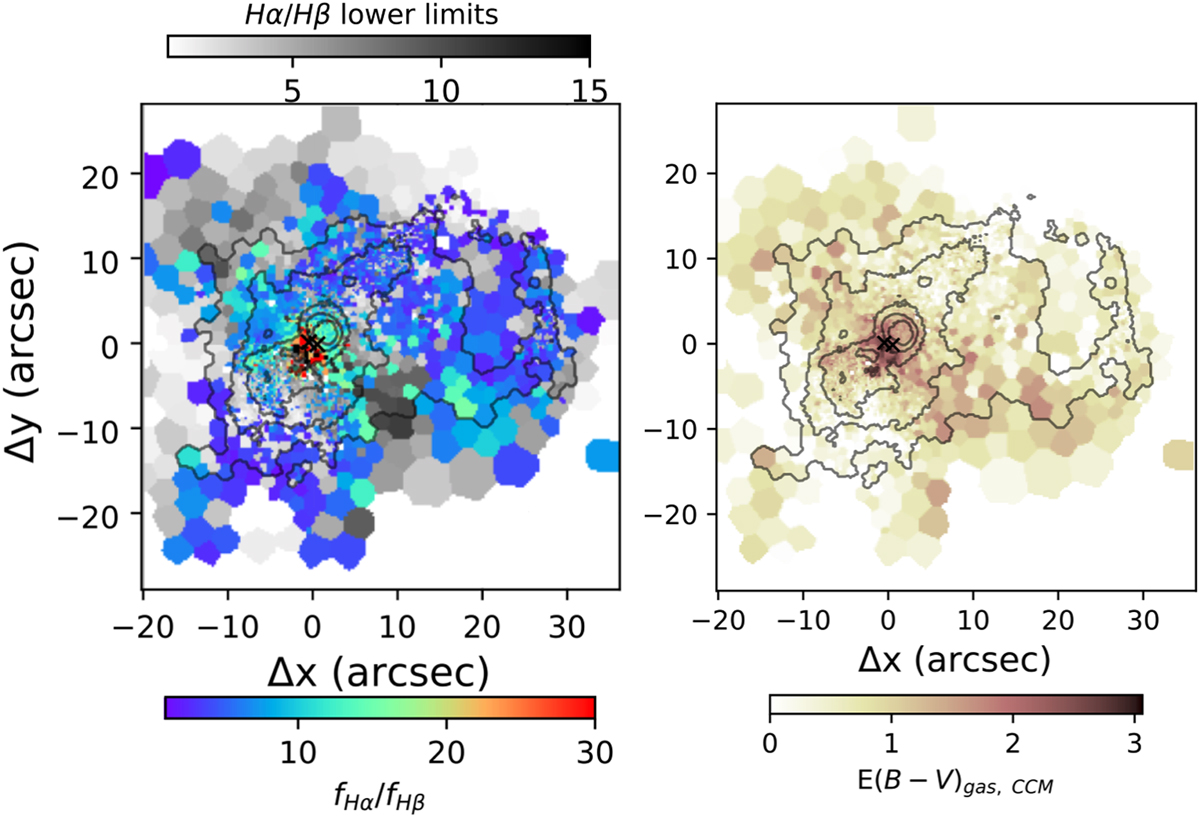
Left: Balmer decrement measurements (purple to red) and lower limits (grey to black) across the MUSE FOV. Hα and Hβ fluxes are derived from the fitted total line profiles; 3σ upper limits for the Hβ flux are used to derive Balmer decrement lower limits. Right: E(B − V)gas map of Arp220, derived from the Hα/Hβ ratios in the top-left panel using the CCM extinction law.
Current usage metrics show cumulative count of Article Views (full-text article views including HTML views, PDF and ePub downloads, according to the available data) and Abstracts Views on Vision4Press platform.
Data correspond to usage on the plateform after 2015. The current usage metrics is available 48-96 hours after online publication and is updated daily on week days.
Initial download of the metrics may take a while.