Fig. 16.
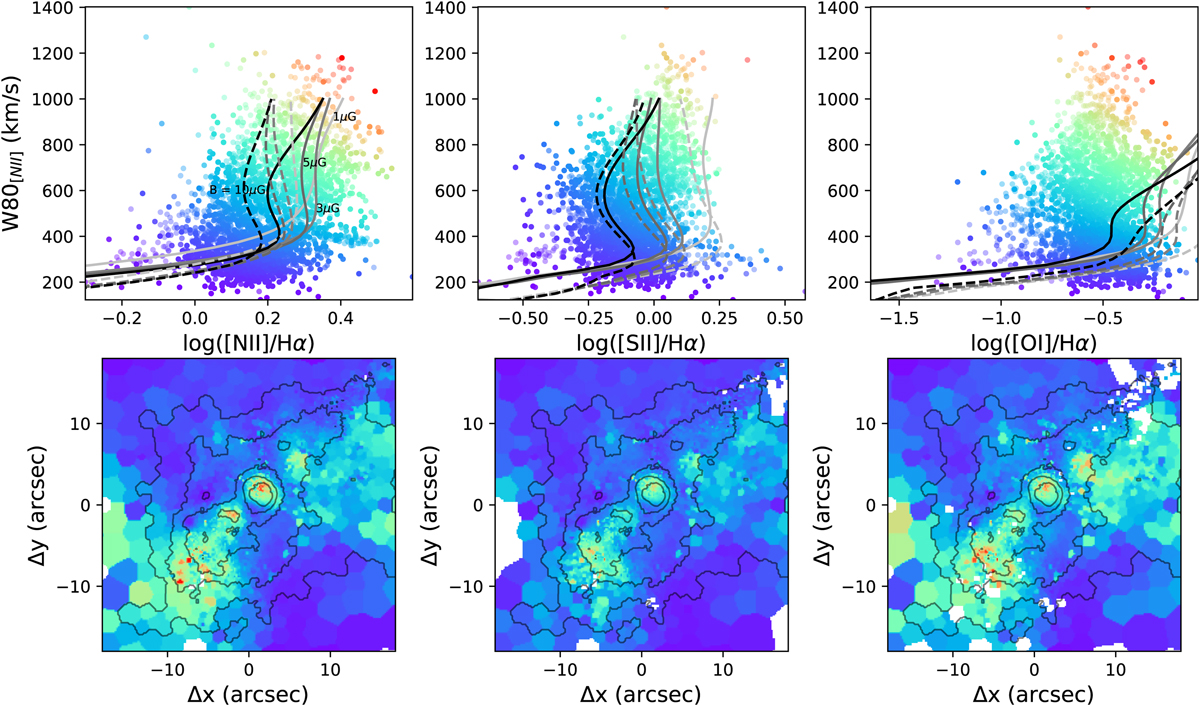
Top panels: W80[NII] against log([N II]/)Hα, log([S II]/)Hα, and log([O I]/)Hα, from left to right, obtained from the fitted total line profiles. The plotted measurements are colour-coded from purple to red, going from low to high flux ratios and line widths. Dashed and solid lines represent shock model grids from MAPPING V (Sutherland & Dopita 2017; Sutherland et al. 2018). Each line connects predicted line ratios of a certain metallicity (1 Z⊙, solid lines; 2 Z⊙, dashed lines), pre-shock electron density (1 cm−3), and magnetic field (from 1 to 10 μG, as labelled in the first panel for 2-Z⊙ models), with changing shock velocities Vs in the range 200 − 1000 km s−1. We assumed a one-to-one correlation between Vs and W80. Bottom panels: Arp220 maps associated with the top panel diagrams, using the same colour codes.
Current usage metrics show cumulative count of Article Views (full-text article views including HTML views, PDF and ePub downloads, according to the available data) and Abstracts Views on Vision4Press platform.
Data correspond to usage on the plateform after 2015. The current usage metrics is available 48-96 hours after online publication and is updated daily on week days.
Initial download of the metrics may take a while.