Fig. 14.
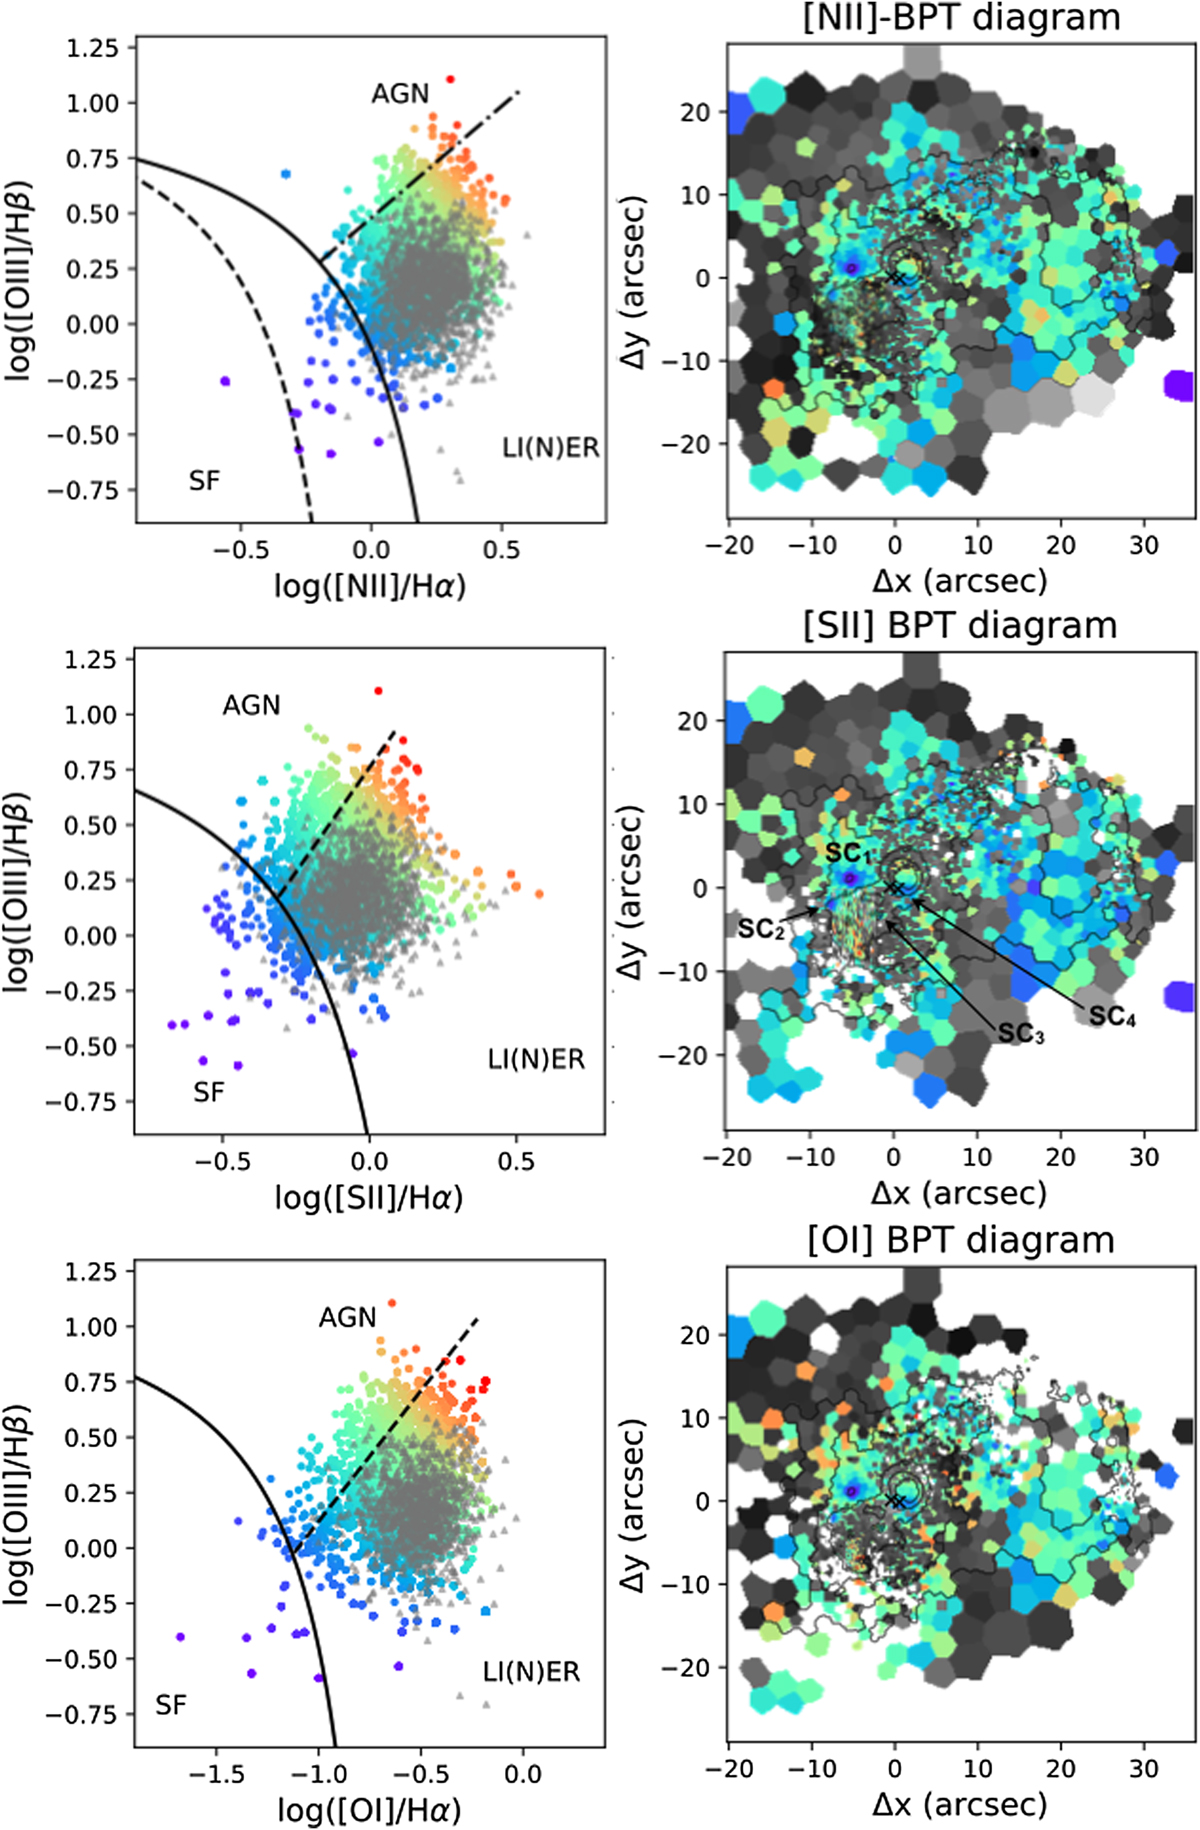
Arp220 resolved-BPT diagrams. Left-hand panels: we report the [N II]-BPT (upper), [S II]-BPT (centre), and [O I]-BPT (bottom) diagrams for each Voronoi bin with S/N > 3 in each line. Black curves separate AGN-, SF-, and LI(N)ER-like line ratios (see text for details). For each diagnostic, a map marking each Voronoi bin with the colour corresponding to increasing flux ratios is shown on the right. The colour codes are defined using the ELR functions described in the text. Grey points correspond to [O III]/Hβ lower limits; light-to-dark grey colours in the maps correspond to increasing [N II]/Hα (top right), [S II]/Hα (middle), and [O I]/Hα (bottom) ratios. The contours of [N II] line emission are over-plotted in black. Most of the gas emission is dominated by LI(N)ER-like ionisation. In the [S II]-BPT map, we labelled the position of the four SCs identified in this work.
Current usage metrics show cumulative count of Article Views (full-text article views including HTML views, PDF and ePub downloads, according to the available data) and Abstracts Views on Vision4Press platform.
Data correspond to usage on the plateform after 2015. The current usage metrics is available 48-96 hours after online publication and is updated daily on week days.
Initial download of the metrics may take a while.