Fig. 13.
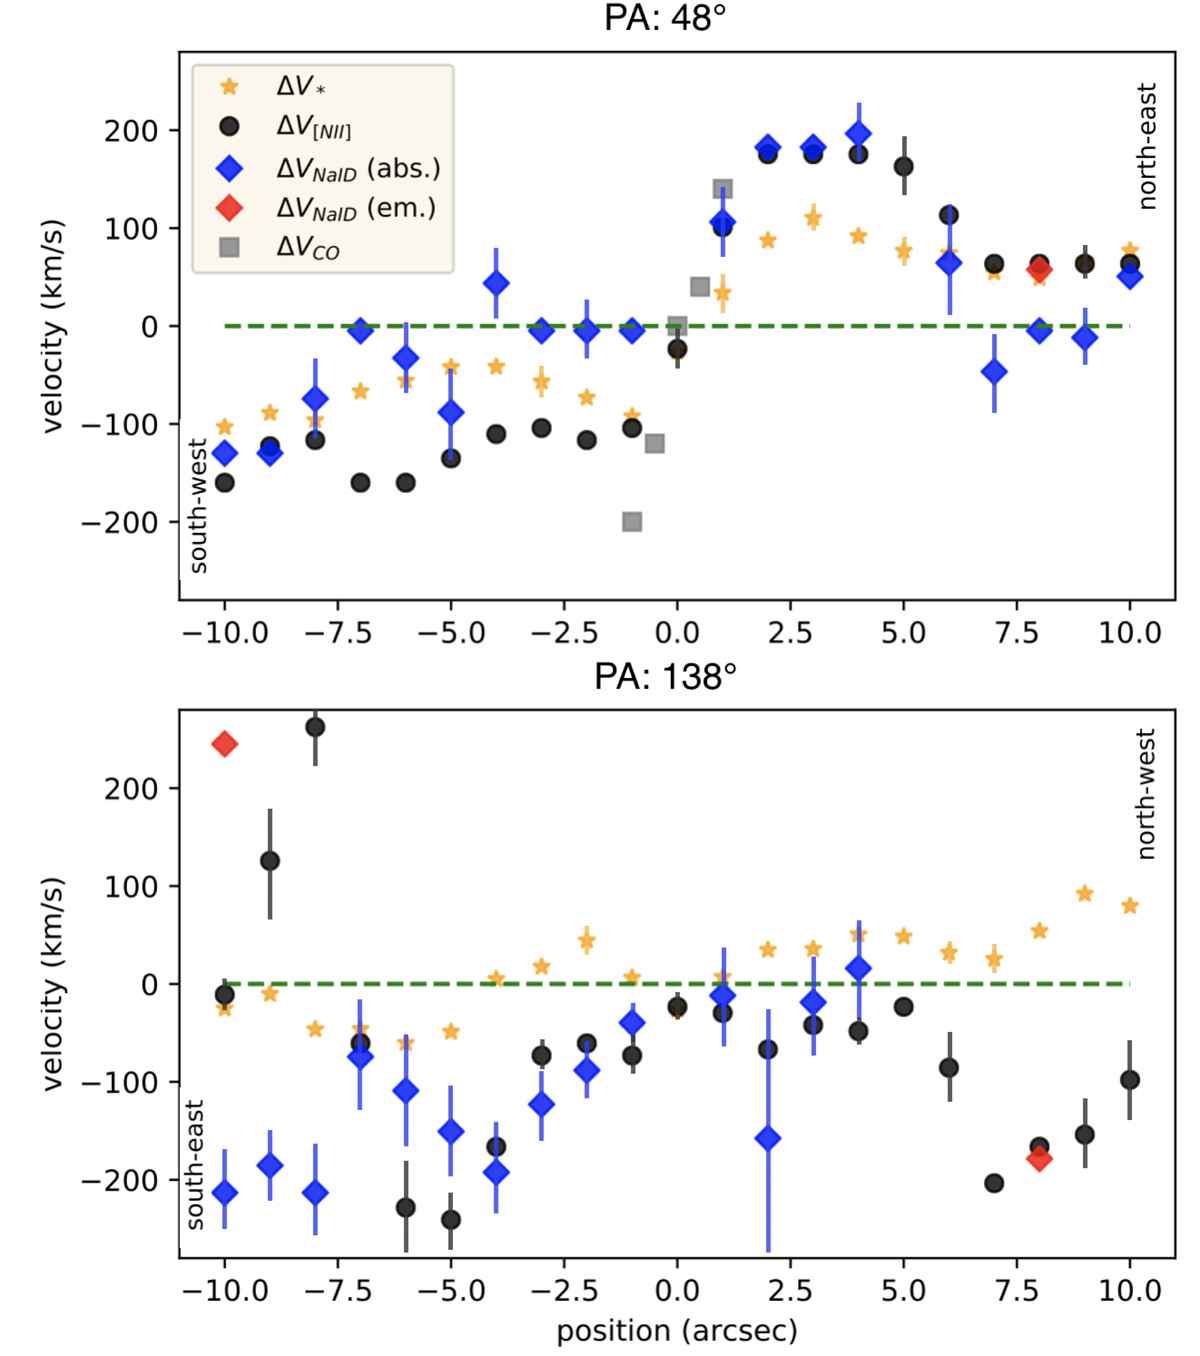
Position-velocity diagram, with positions varying along PA = 48° (top) and PA = 138° (bottom) for the stellar component, [N II] gas, and Na ID gas, as labelled in the figure. Distances on the x-axis are measured from the intermediate position between the two nuclei, from the bottom to the top of the FOV. Stellar and gas velocity measurements are obtained by averaging 3 × 3 pixels along a given PA from the maps shown in Figs. 3, 10–12; CO(2–1) velocities are obtained from Fig. 5 in Scoville et al. (1997).
Current usage metrics show cumulative count of Article Views (full-text article views including HTML views, PDF and ePub downloads, according to the available data) and Abstracts Views on Vision4Press platform.
Data correspond to usage on the plateform after 2015. The current usage metrics is available 48-96 hours after online publication and is updated daily on week days.
Initial download of the metrics may take a while.