Free Access
Fig. 10.
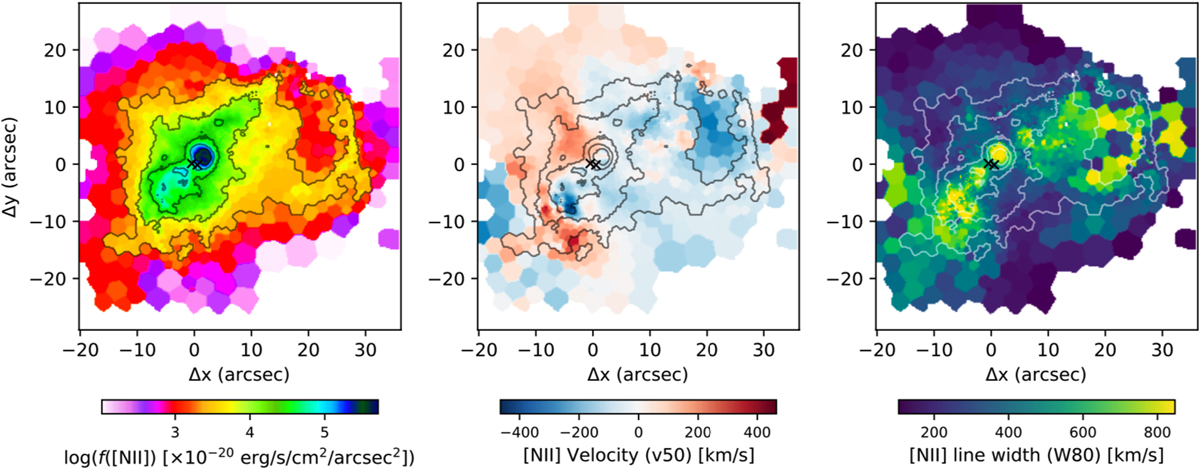
[N II] multi-component fit results. Left: integrated flux; the first solid contour is 3 × 10⁻¹⁷ erg s−1 cm−2 arcsec−2, and the jump is 0.5 dex. Centre: [N II] velocity (v50) map. Right: [N II] line width (W80) map. The solid contours are from the left-hand panel. The crosses mark the two nuclei.
Current usage metrics show cumulative count of Article Views (full-text article views including HTML views, PDF and ePub downloads, according to the available data) and Abstracts Views on Vision4Press platform.
Data correspond to usage on the plateform after 2015. The current usage metrics is available 48-96 hours after online publication and is updated daily on week days.
Initial download of the metrics may take a while.