Fig. B.1.
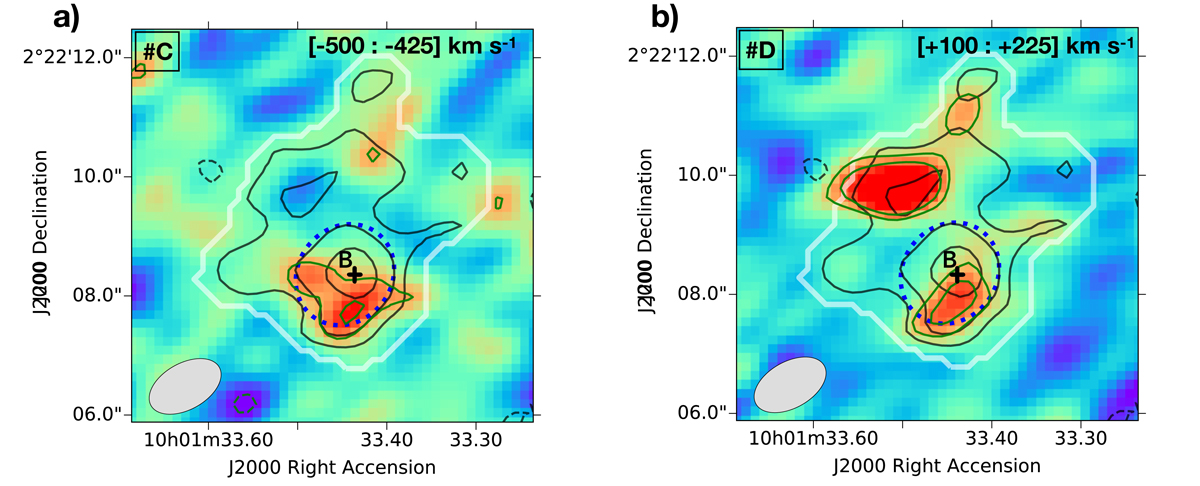
Panel a: velocity-integrated [CII] maps of #C and panel b: #D, obtained by collapsing the spectral channels corresponding to a 2 × FWHM interval centred on their z[CII] (see spectra in Fig. 4a, and values in Table 1). The velocity ranges used to collapse the datacubes are shown in the top-left corners. The rest-frame UV centroid of #B is indicated with a plus symbol. The dashed blue ellipse defined in Fig. 3 (see Sect. 3.3) is shown for reference. The grey solid line and the black contours indicate the significance level of the [CII] flux emitted by the full system as defined in Fig. 4b. The green solid (dashed) contours indicate the positive (negative) significance levels at [3, 4]σ of the [CII] flux maps of #C panel a and #D panel b. To help the visualisation of panel b, we used a maximum value of surface brightness in the colour-map range as defined by excluding the northern bright spot (corresponding to a fraction of the emission of #A). The ALMA beam size is given in the bottom-left corner. North is up and east is to the left.
Current usage metrics show cumulative count of Article Views (full-text article views including HTML views, PDF and ePub downloads, according to the available data) and Abstracts Views on Vision4Press platform.
Data correspond to usage on the plateform after 2015. The current usage metrics is available 48-96 hours after online publication and is updated daily on week days.
Initial download of the metrics may take a while.