Fig. 4.
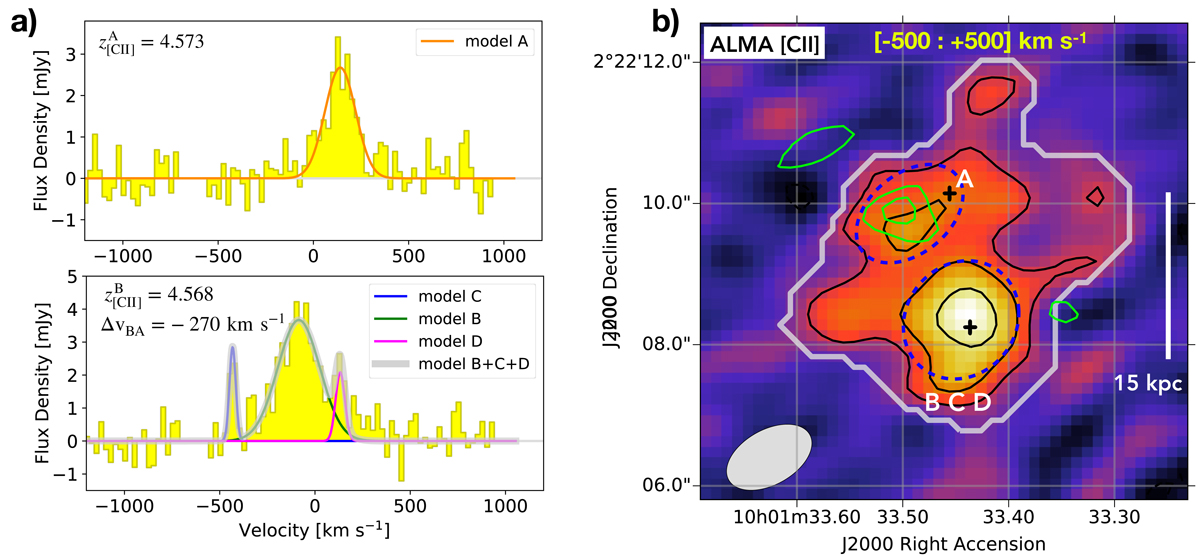
Panel a: [CII] spectra (yellow) of the individual galaxy components in the merging system are shown: #A in the upper panel, and the combined spectrum of #B, #C, #D in the lower panel. Solid coloured lines represent Gaussian models of the spectra. Panel b: velocity-integrated [CII] flux map obtained integrating the broad velocity range [ − 500 : +500] km s−1, to visualise the total [CII] emission arising from the full system. Black plus symbols show the rest-frame UV centroids of #A and #B. The dashed blue ellipses defined in Fig. 3 (see Sect. 3.3) are shown for reference. Black solid (dashed) contours indicate the positive (negative) significance levels at [2, 4, 6]σ of [CII] flux, where σ[CII] = 0.13 Jy km s−1 beam−1. Green contours indicate (as in Fig. 3) the FIR-continuum significance levels [3, 4]σ, where σcont = 59 μJy beam−1. The grey solid line indicates the 1σ level of the total [CII] emission, and it is used as a reference aperture for the extraction of the full [CII] spectrum arising from the entire system. The ALMA beam size is given in the bottom-left corner. A scale of 15 kpc is shown on the right side. North is up and east is to the left.
Current usage metrics show cumulative count of Article Views (full-text article views including HTML views, PDF and ePub downloads, according to the available data) and Abstracts Views on Vision4Press platform.
Data correspond to usage on the plateform after 2015. The current usage metrics is available 48-96 hours after online publication and is updated daily on week days.
Initial download of the metrics may take a while.