Fig. 3.
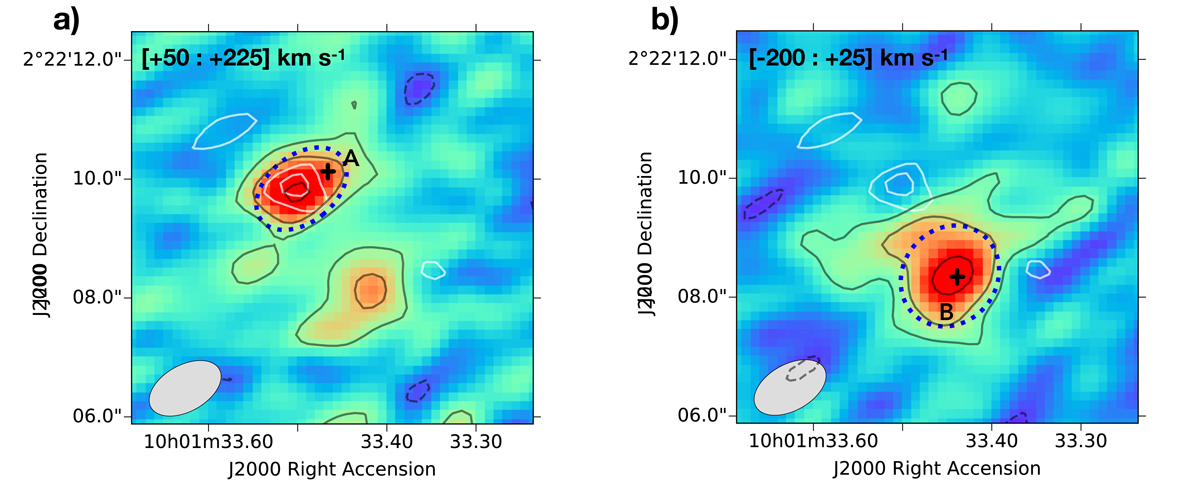
Panel a: velocity-integrated [CII] map of VC_9780 (#A) and panel b: C15_705574 (#B), obtained by collapsing channels (velocity ranges in the upper-left corners) of line-emission in 1″-aperture spectra (see Sect. 3.3) centred on the rest-frame UV centroids of #A and #B (indicated with a black plus symbol). Black solid (dashed) contours indicate the positive (negative) significance levels at [2, 4, 8]σ of [CII] flux, where σ[CII] = 50 mJy km s−1 beam−1 in panel a and σ[CII] = 57 mJy km s−1 beam−1 in panel b. The white contours indicate the positive significance levels at [3, 4]σ of FIR-continuum emission, where σcont = 59 μJy beam−1. No negative contours at the same significance levels were found. The dashed blue ellipses indicate the beam-convolved FWHMx × FWHMy regions obtained by 2D Gaussian models, and correspond to the apertures used to extract the final [CII] spectra of #A and #B (see Sect. 3.3), shown in Fig. 4. The ALMA beam sizes are given in the bottom-left corners. North is up and east is to the left.
Current usage metrics show cumulative count of Article Views (full-text article views including HTML views, PDF and ePub downloads, according to the available data) and Abstracts Views on Vision4Press platform.
Data correspond to usage on the plateform after 2015. The current usage metrics is available 48-96 hours after online publication and is updated daily on week days.
Initial download of the metrics may take a while.