Fig. 1.
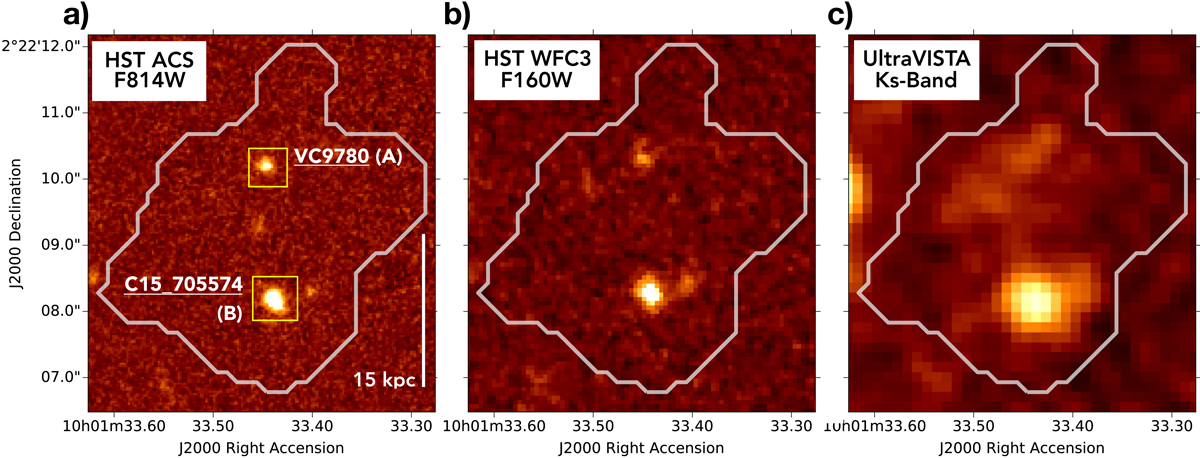
Panel a: HST/ACS F814W (i-band; Koekemoer et al. 2007), panel b: HST/WFC3 F160W (Faisst et al., in prep.), and panel c: UltraVISTA DR4 Ks-band (McCracken et al. 2012) images of the system. The rest-frame UV positions of VC_9780 (dubbed #A) and C15_705574 (dubbed #B) are highlighted with a yellow square in panel a. The grey contour indicates the extension of the full [CII]-emitting region (see Sect. 3.3). The white bar shows a reference length of 15 kpc. North is up and east is to the left.
Current usage metrics show cumulative count of Article Views (full-text article views including HTML views, PDF and ePub downloads, according to the available data) and Abstracts Views on Vision4Press platform.
Data correspond to usage on the plateform after 2015. The current usage metrics is available 48-96 hours after online publication and is updated daily on week days.
Initial download of the metrics may take a while.