Fig. 7.
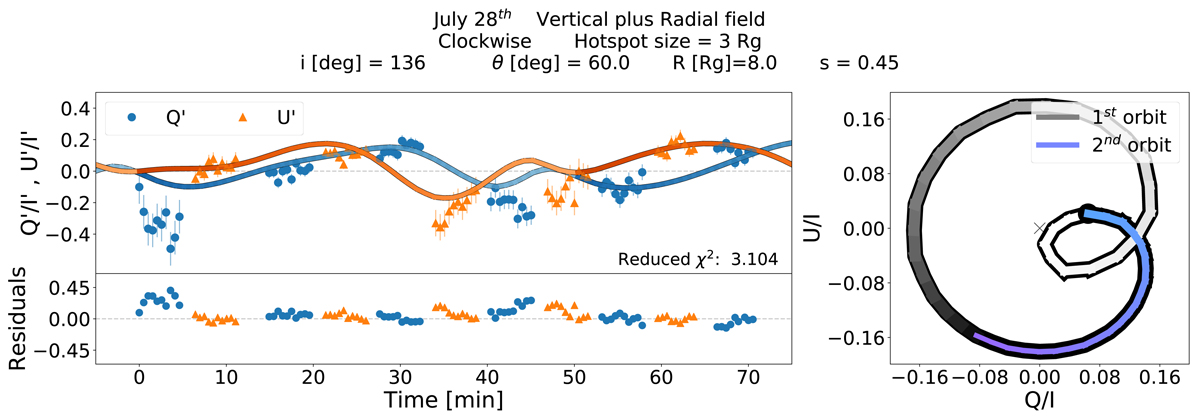
Best fit to the July 28 NIR flare. The colour gradient denotes the periodic evolution of the hotspot along its orbit, moving from darker shades to lighter as the hotpot completes one revolution. The curves qualitatively reproduce the data. The preferred parameter combination favours a radius of 8 Rg and both moderate i and θ values.
Current usage metrics show cumulative count of Article Views (full-text article views including HTML views, PDF and ePub downloads, according to the available data) and Abstracts Views on Vision4Press platform.
Data correspond to usage on the plateform after 2015. The current usage metrics is available 48-96 hours after online publication and is updated daily on week days.
Initial download of the metrics may take a while.