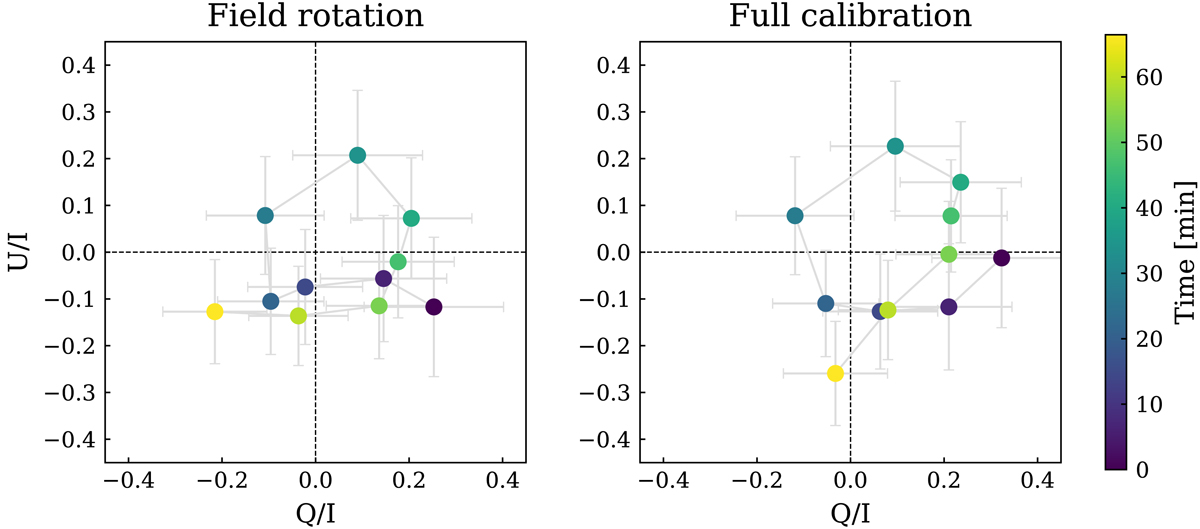
Fig. 2.

Reconstructed evolution of the on-sky linear Stokes parameters in QU space for the July 28 flare, linearly interpolating to fill in U′ and Q′ where the other is measured. Colour indicates time in minutes. Left: previous calibration where the quantities have only been subjected to a field rotation correction (Gravity Collaboration 2018b). Right: full new calibration including VLTI systematics and Stokes V′ reconstruction. In both cases, the flare traces 1.5 loops during its 60 − 70 min evolution.
Current usage metrics show cumulative count of Article Views (full-text article views including HTML views, PDF and ePub downloads, according to the available data) and Abstracts Views on Vision4Press platform.
Data correspond to usage on the plateform after 2015. The current usage metrics is available 48-96 hours after online publication and is updated daily on week days.
Initial download of the metrics may take a while.


