Open Access
Fig. F.1.
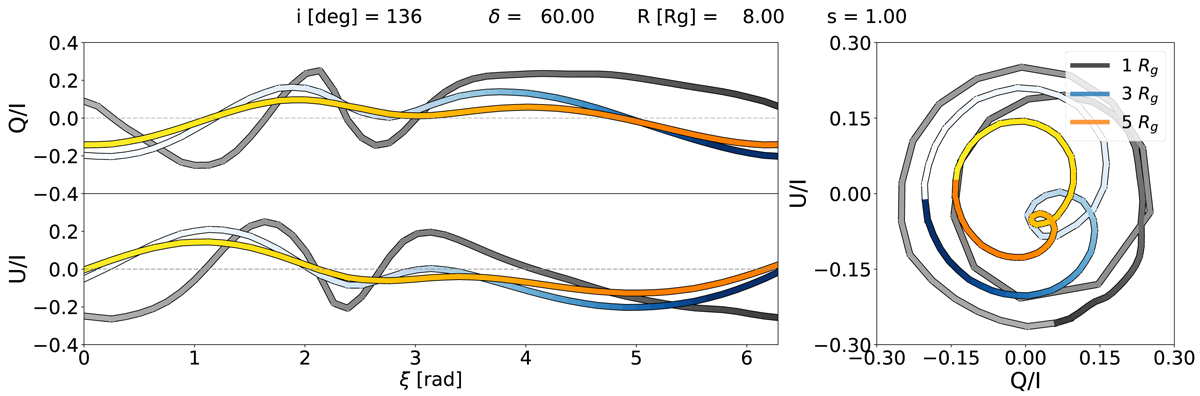
Comparison of three numerical calculations with all identical parameters, except for Rspot: 1, 3, and 5 Rg. As the hotspot size increases, the curve features are smoothed from beam depolarisation by sampling larger magnetic field regions and averaging out the different polarisation directions in time.
Current usage metrics show cumulative count of Article Views (full-text article views including HTML views, PDF and ePub downloads, according to the available data) and Abstracts Views on Vision4Press platform.
Data correspond to usage on the plateform after 2015. The current usage metrics is available 48-96 hours after online publication and is updated daily on week days.
Initial download of the metrics may take a while.