Fig. 7
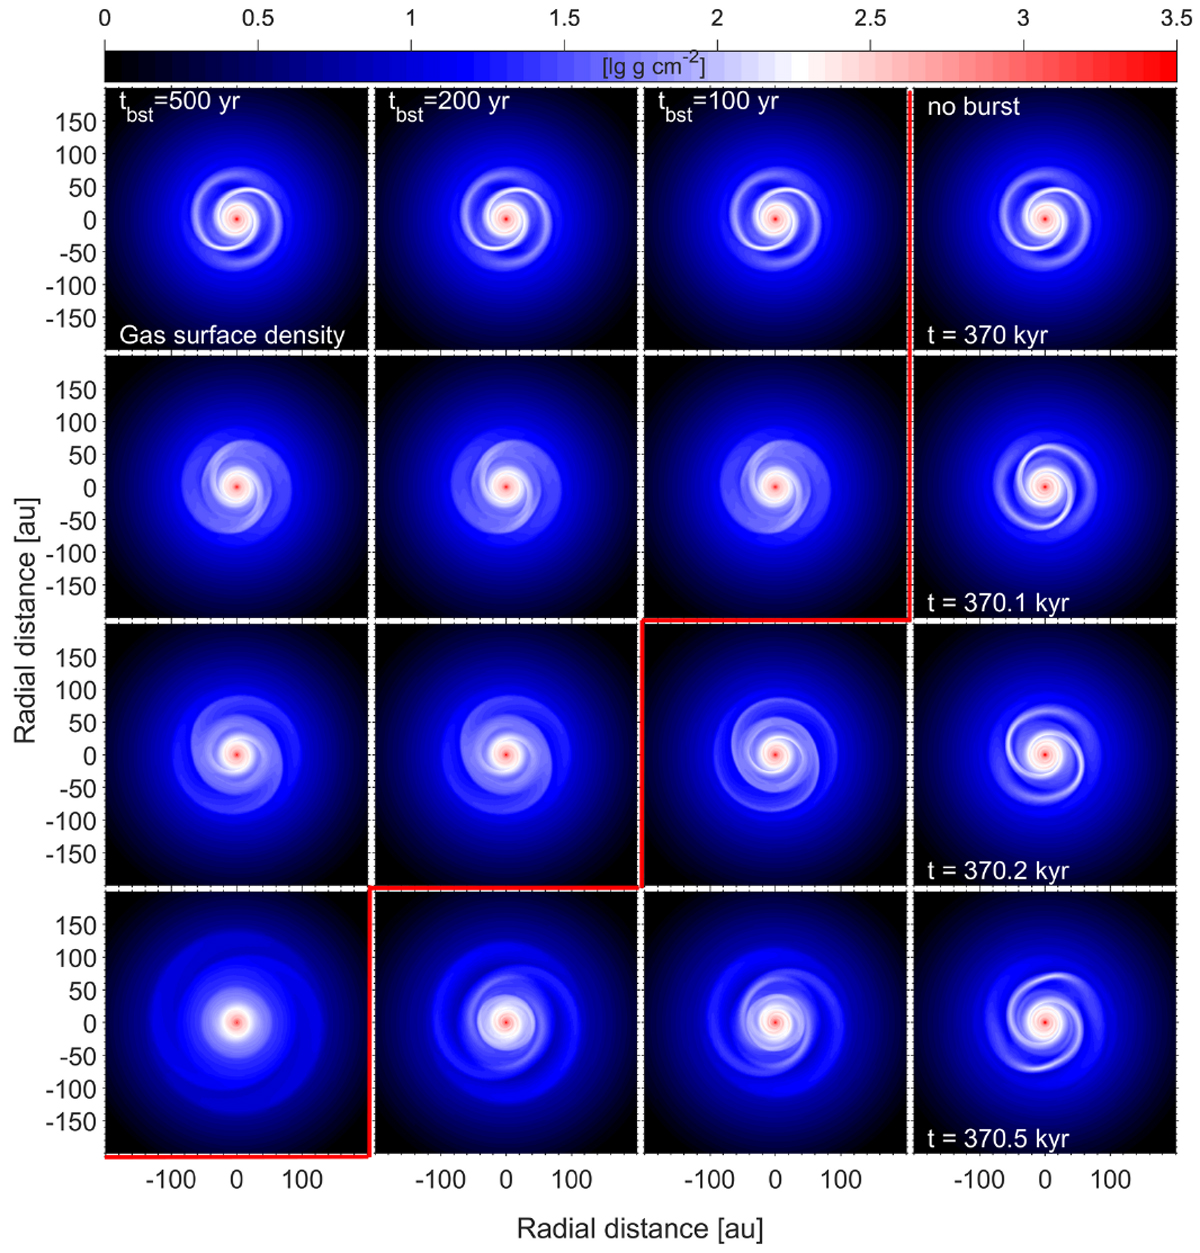
Response of the spiral pattern to bursts of different duration. The gas surface density in the inner 400 × 400 au2 box is shown. Columns from left to right represent models with different burst durations: 500 yr, 200 yr, 100 yr, and the model without the burst. The initial 500 yr since the onset of the burst with a constant-magnitude shape are shown. The red line separates disk images in the burst phase from those in the post-burst or no-burst phase. The scale bar is in log g cm−2.
Current usage metrics show cumulative count of Article Views (full-text article views including HTML views, PDF and ePub downloads, according to the available data) and Abstracts Views on Vision4Press platform.
Data correspond to usage on the plateform after 2015. The current usage metrics is available 48-96 hours after online publication and is updated daily on week days.
Initial download of the metrics may take a while.