Free Access
Fig. 17
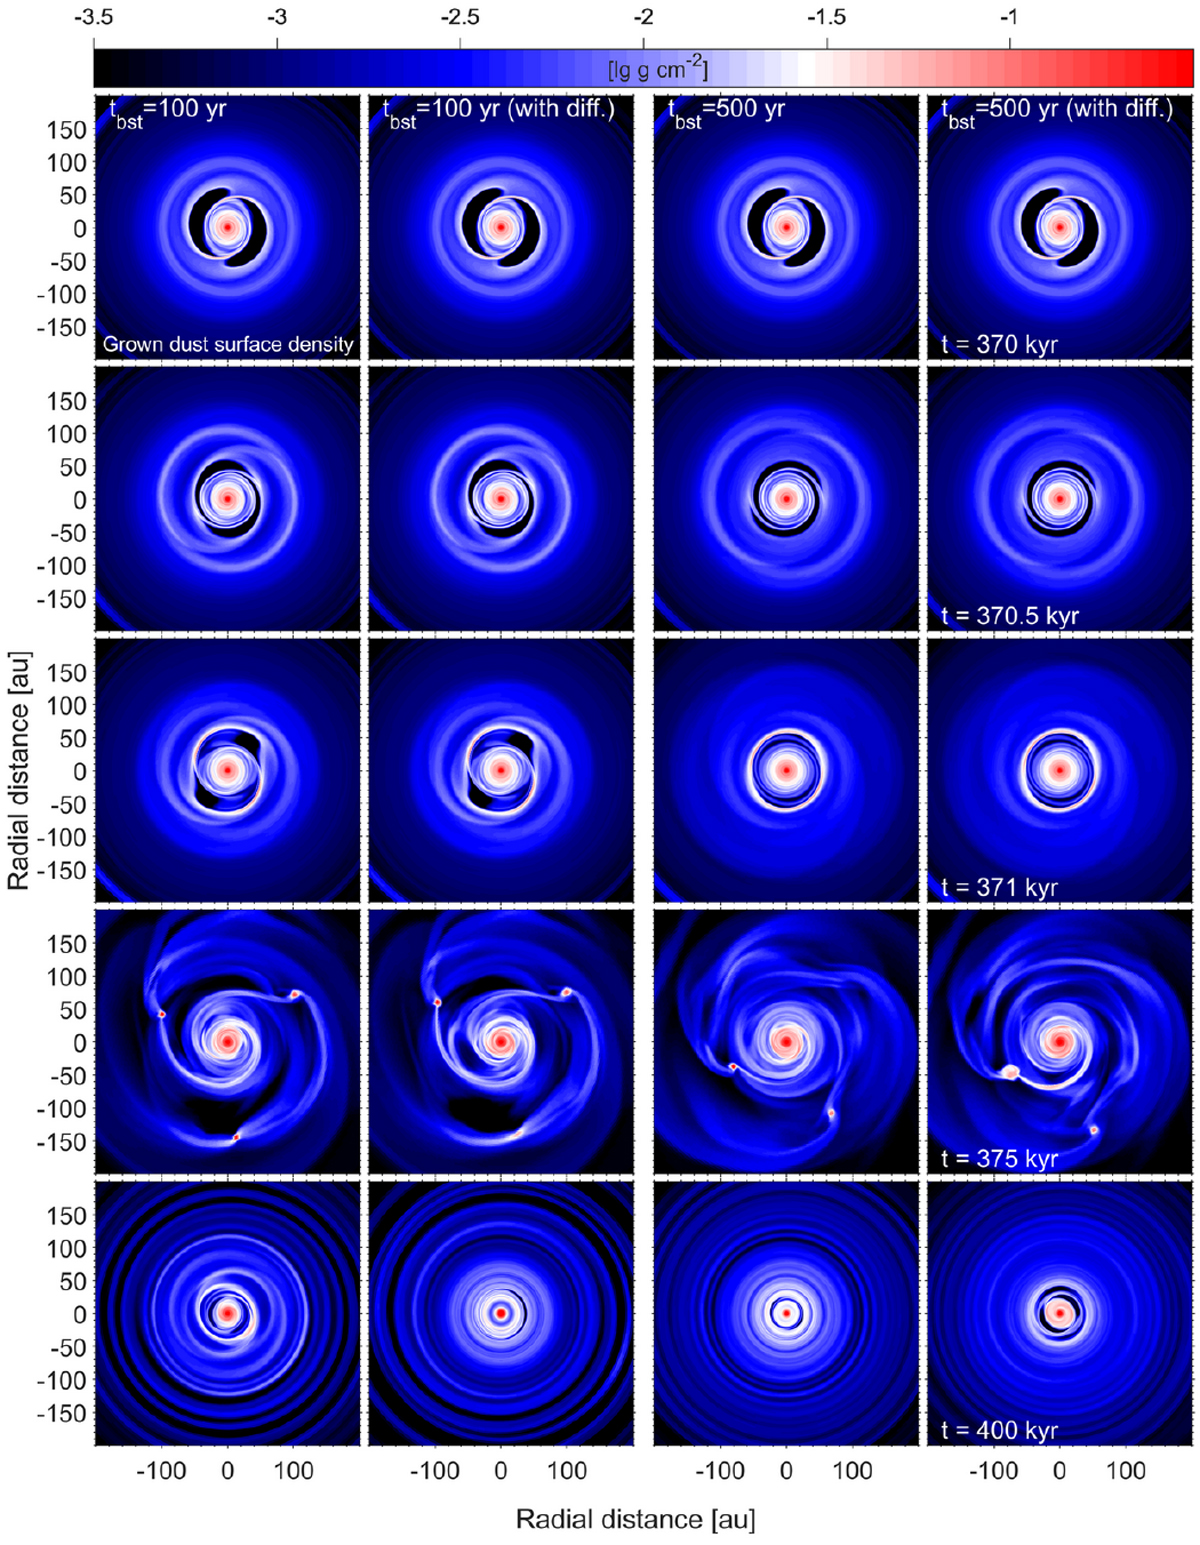
Effect of turbulent diffusion on the spatial distribution of grown dust. The two columns on the right present the comparison for the tbst = 500 yr burst of constant amplitude, while the two columns on the left do that for the tbst = 100 yr burst. The scale bar is in log g cm−2.
Current usage metrics show cumulative count of Article Views (full-text article views including HTML views, PDF and ePub downloads, according to the available data) and Abstracts Views on Vision4Press platform.
Data correspond to usage on the plateform after 2015. The current usage metrics is available 48-96 hours after online publication and is updated daily on week days.
Initial download of the metrics may take a while.