Fig. 12
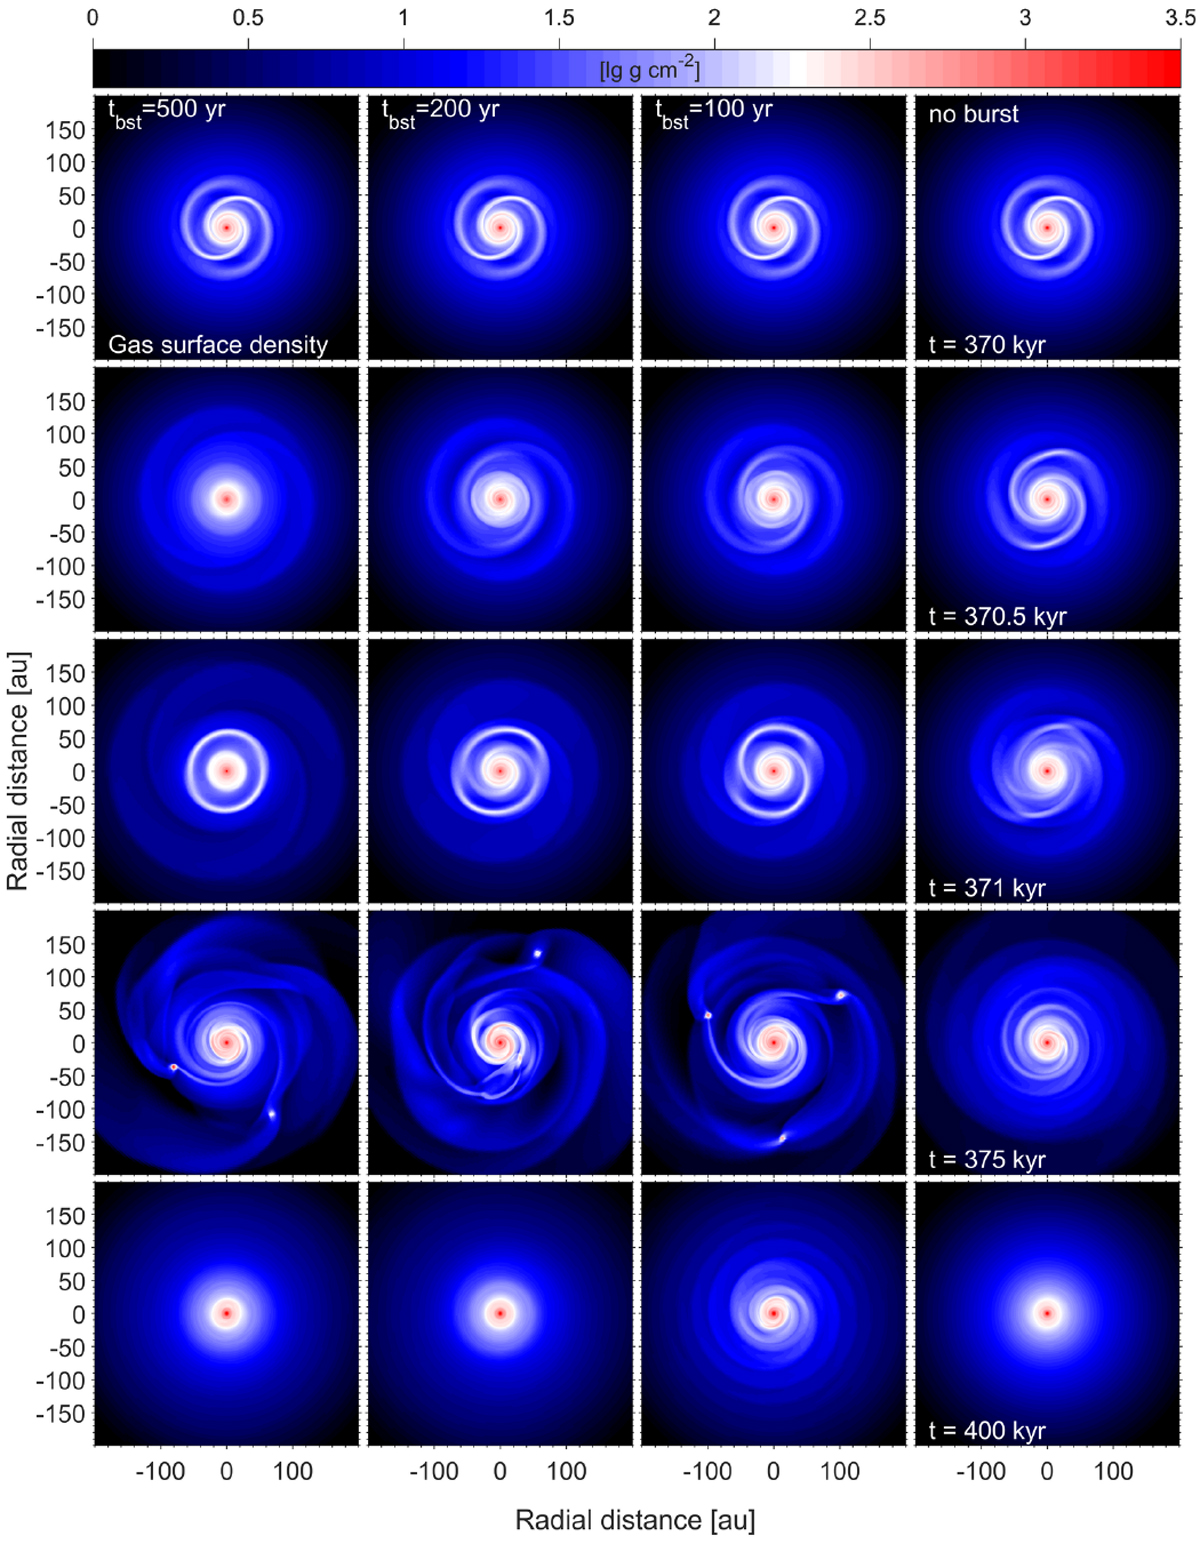
Gas disk evolution in the model without the burst (right-hand column) and in the models with the bursts of various duration (from left to right): tbst = 500 yr – first column, tbst = 200 yr – second column, and tbst = 100 yr – third column. Four time instances starting from the onset of the burst are shown: 0.5 kyr (second row), 1.0 kyr (third row), 5.0 kyr (fourth row), and 30 kyr (bottom row). The scale bar shows the gas surface density in g cm−2 (log units).
Current usage metrics show cumulative count of Article Views (full-text article views including HTML views, PDF and ePub downloads, according to the available data) and Abstracts Views on Vision4Press platform.
Data correspond to usage on the plateform after 2015. The current usage metrics is available 48-96 hours after online publication and is updated daily on week days.
Initial download of the metrics may take a while.