Fig. 10
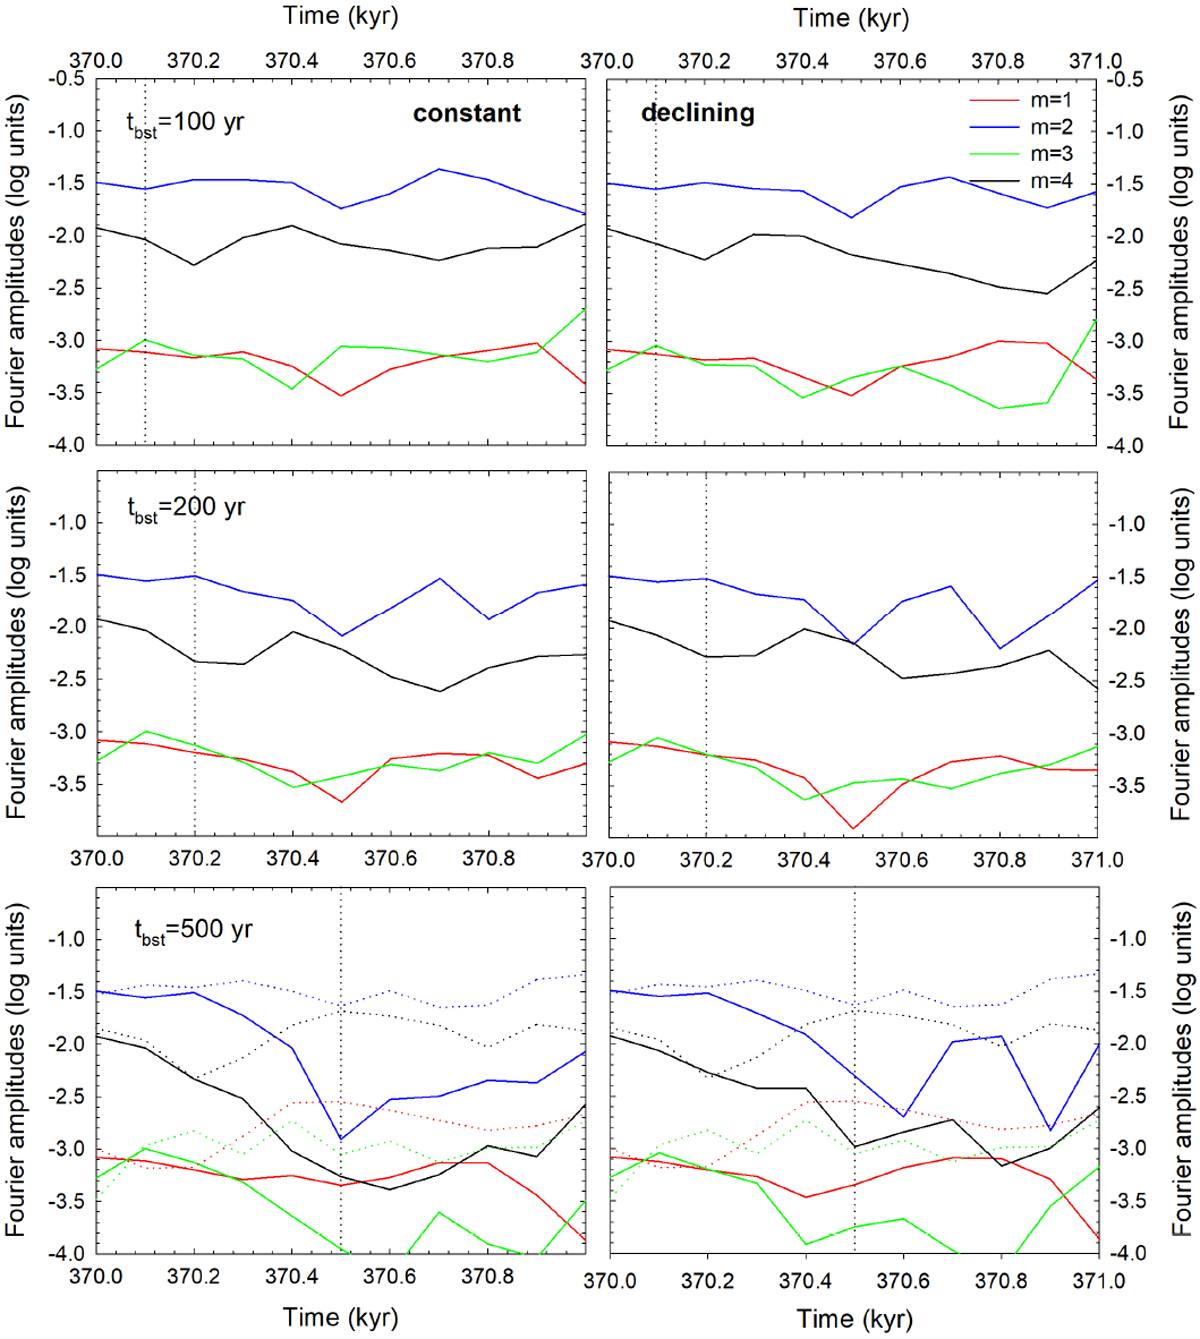
Global Fourier amplitudes vs. time in models with various burst durations tbst. The four lowest modes m = 1, 2, 3, and 4 are shown. The left and right columns correspond to the constant-magnitude and declining-magnitude bursts, respectively.The vertical dotted lines indicate the end of the burst in each model. The dotted lines in the bottom row show Fourier amplitudes for the model without the burst for comparison.
Current usage metrics show cumulative count of Article Views (full-text article views including HTML views, PDF and ePub downloads, according to the available data) and Abstracts Views on Vision4Press platform.
Data correspond to usage on the plateform after 2015. The current usage metrics is available 48-96 hours after online publication and is updated daily on week days.
Initial download of the metrics may take a while.