Fig. 3.
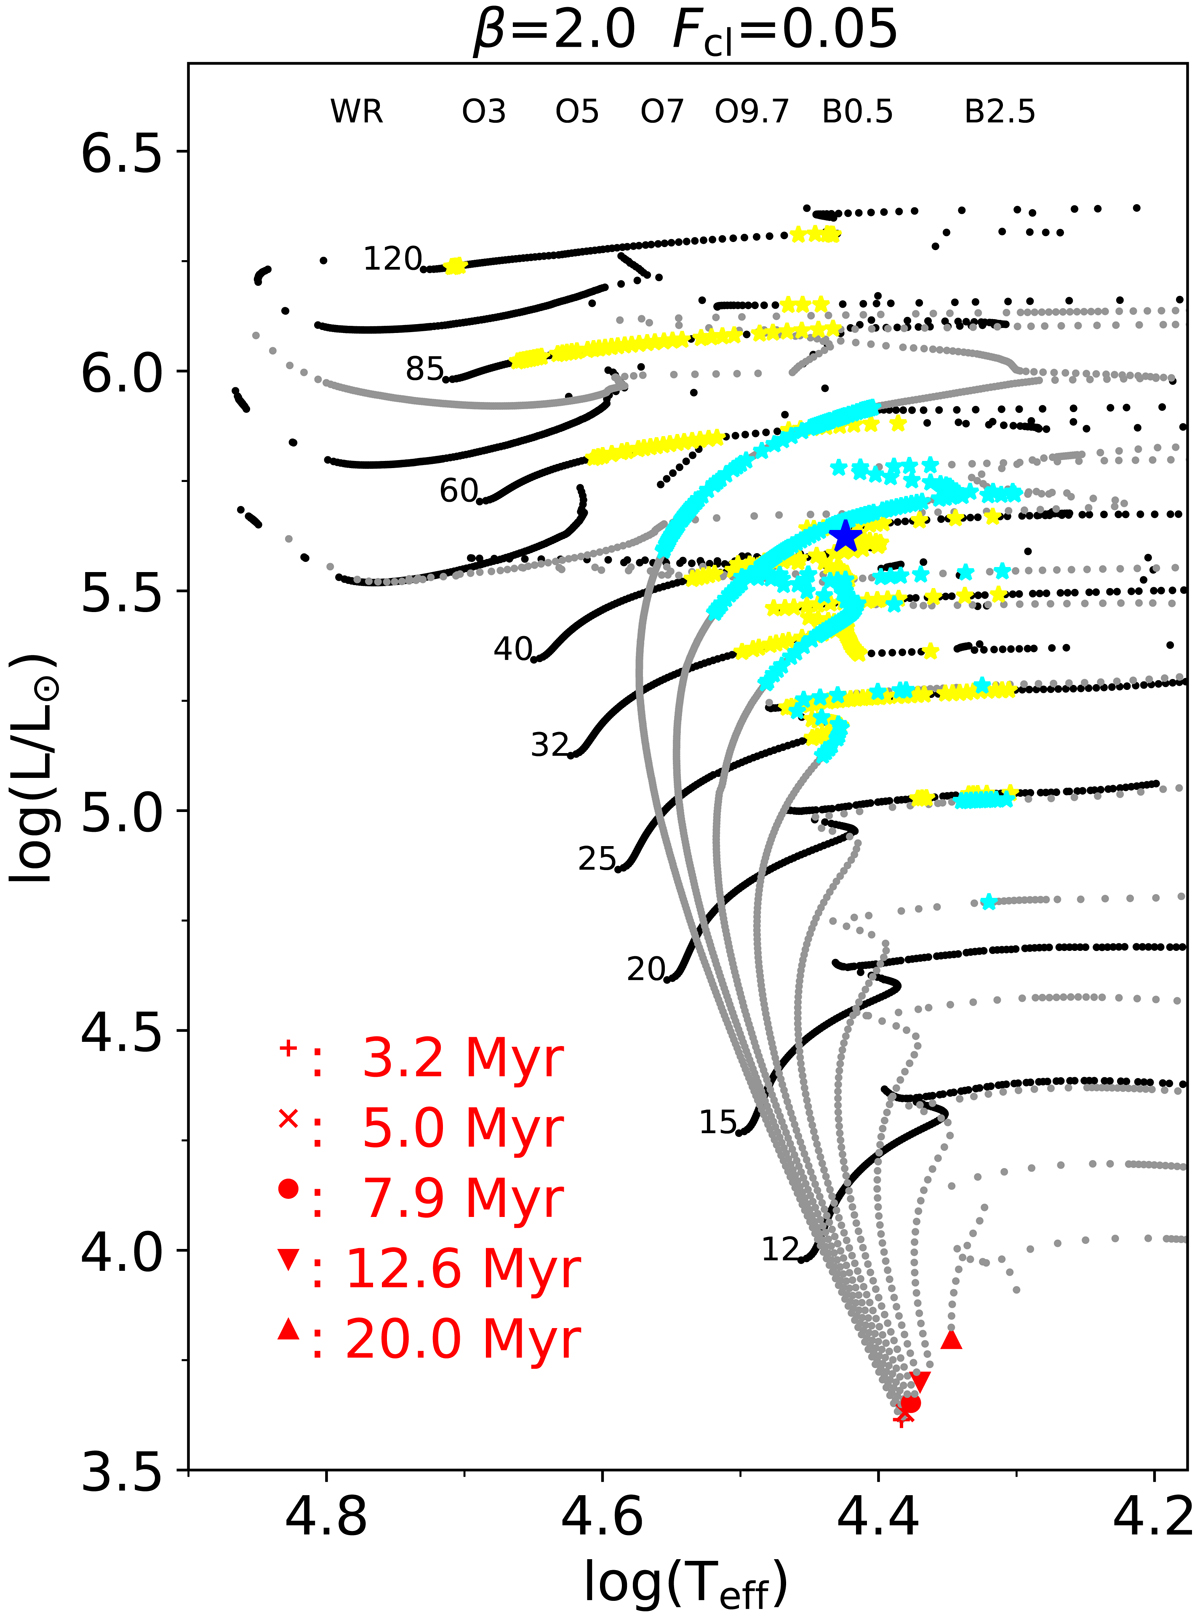
Hertzsprung-Russel diagram for β = 2, Fcl = 0.05, and solar composition without rotational enhancement. The black and gray symbols mark the evolutionary tracks and isochrones, respectively, calclulated by Ekström et al. (2012). We use the stellar parameters from these models, together with our choice of wind parameters, to create the CMFGEN atmospheric models in our grid. The yellow and cyan stars indicate evolutionary track and isochrone models, respectively, for which we have already generated an atmospheric model. The large blue star shows the location of our best-fit model to the observation of ϵ Ori. The numbers left of the evolutionary tracks are the initial masses of the tracks (in M⊙). They also mark the approximate location of the ZAMS. The red symbols below selected isochrones indicate their ages (in 106 years). At the top of the figure we indicate the approximate locations of selected spectral classes.
Current usage metrics show cumulative count of Article Views (full-text article views including HTML views, PDF and ePub downloads, according to the available data) and Abstracts Views on Vision4Press platform.
Data correspond to usage on the plateform after 2015. The current usage metrics is available 48-96 hours after online publication and is updated daily on week days.
Initial download of the metrics may take a while.