Fig. 13.
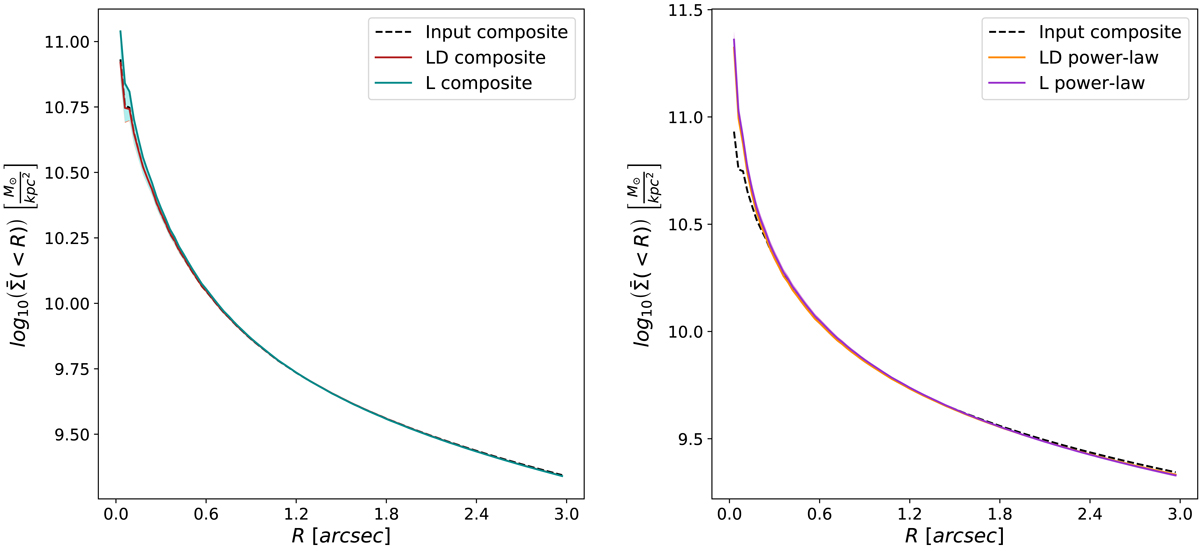
Average surface mass density ![]() for the LD composite and the L composite models (left panel), and for the power-law models LD power-law and L power-law (right panel) as compared to the input composite mock, plotted with the relative error bars. All models recover the input closely at the value of the Einstein radius (∼1.6″ for source at reshift 0.654). On the left panel, the L composite model gets peakier towards the centre, but is still able to recover the input within the error bars (light blue shaded region). This does not appear to be the case for the LD power-law and L power-law (right panel), which differ from the input for R < 0.3″. However, at larger radii, we cannot easily distinguish between power-law and composite models from the average surface mass density.
for the LD composite and the L composite models (left panel), and for the power-law models LD power-law and L power-law (right panel) as compared to the input composite mock, plotted with the relative error bars. All models recover the input closely at the value of the Einstein radius (∼1.6″ for source at reshift 0.654). On the left panel, the L composite model gets peakier towards the centre, but is still able to recover the input within the error bars (light blue shaded region). This does not appear to be the case for the LD power-law and L power-law (right panel), which differ from the input for R < 0.3″. However, at larger radii, we cannot easily distinguish between power-law and composite models from the average surface mass density.
Current usage metrics show cumulative count of Article Views (full-text article views including HTML views, PDF and ePub downloads, according to the available data) and Abstracts Views on Vision4Press platform.
Data correspond to usage on the plateform after 2015. The current usage metrics is available 48-96 hours after online publication and is updated daily on week days.
Initial download of the metrics may take a while.