Fig. 12.
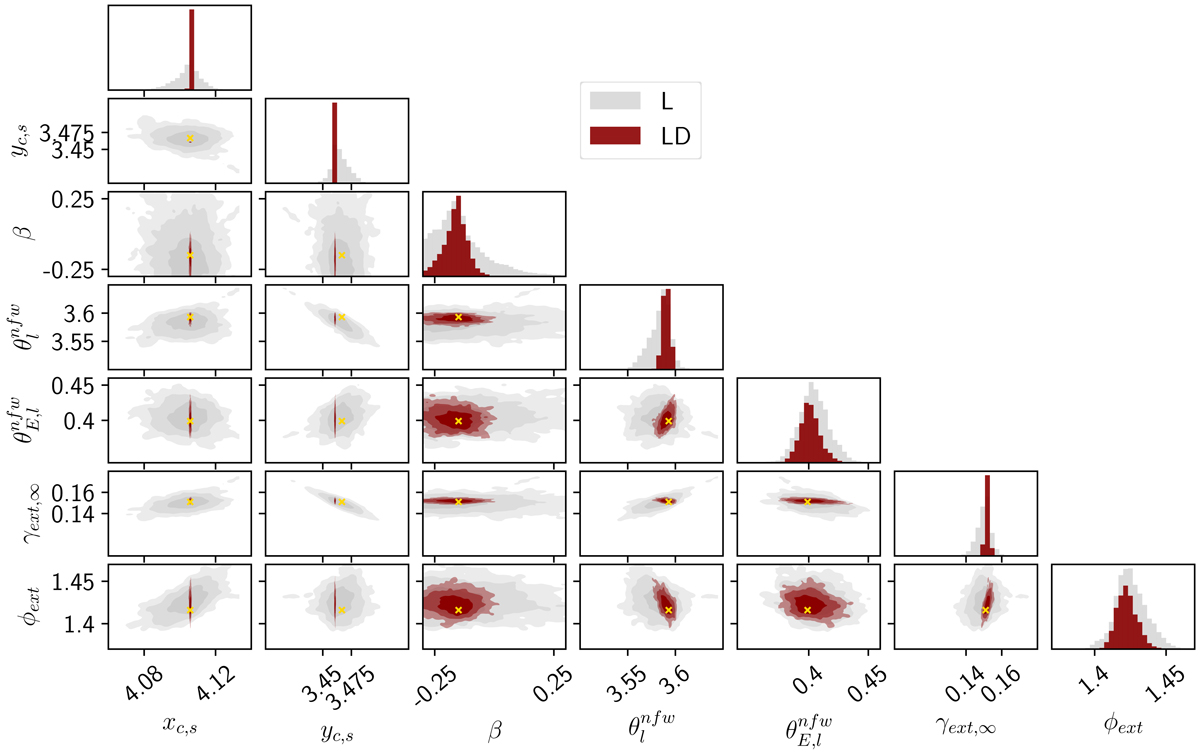
Joint 2D posterior probability distribution for the parameters of the composite mock (presented in Sect. 3.2.4), with kinematic data having a signal-to-noise of 15 in the brightest pixel and binned to have a signal-to-noise of 30 in each bin (shown in Fig. 11). The different contours in the 2D plots indicate, respectively, the 1σ, 2σ and 3σ ranges. Parameters shown are those where the improvement on the constraints coming from the combination of lensing and dynamics (LD in red contours) is more prominent as compared to lensing only (L in grey contours). These parameters are the source centroid xc, s, yc, s, the anisotropy β, the position angle of the lens dark matter profile ![]() , its Einstein radius
, its Einstein radius ![]() , and the shear parameters γext, ∞ and ϕext. In the diagonal are shown the 1D histograms of the corresponding parameter on the x-axis. The input values are marked with a yellow cross.
, and the shear parameters γext, ∞ and ϕext. In the diagonal are shown the 1D histograms of the corresponding parameter on the x-axis. The input values are marked with a yellow cross.
Current usage metrics show cumulative count of Article Views (full-text article views including HTML views, PDF and ePub downloads, according to the available data) and Abstracts Views on Vision4Press platform.
Data correspond to usage on the plateform after 2015. The current usage metrics is available 48-96 hours after online publication and is updated daily on week days.
Initial download of the metrics may take a while.