Fig. 6
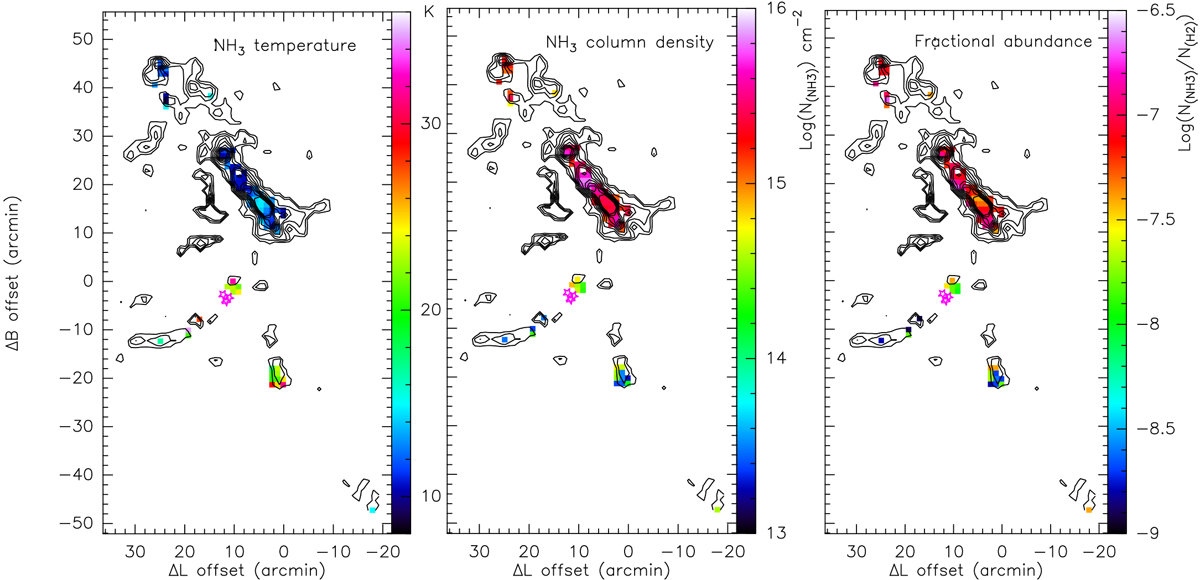
Maps of NH3 kinetic temperature in units of Kelvin (left), the logarithm of the total-NH3 column density in units of cm−2 (middle), and the corresponding logarithm of the fractional abundance (right). The reference position is l = 28.59°, b = 3.55°. Contours of integrated NH3 (1,1) intensity are the same as in Fig. 4 and cover the velocity range 4 < VLSR < 10 km s−1. Contours start at 0.23 K km s−1 (5σ) on a main beam brightness temperature scale and go up in steps of 0.23 K km s−1. Magenta stars show the locations of the OB association (OS1a, IRS1, IRS1a, IRS2, IRS2a, IRS2b, IRS3, and IRS3a) in W 40.
Current usage metrics show cumulative count of Article Views (full-text article views including HTML views, PDF and ePub downloads, according to the available data) and Abstracts Views on Vision4Press platform.
Data correspond to usage on the plateform after 2015. The current usage metrics is available 48-96 hours after online publication and is updated daily on week days.
Initial download of the metrics may take a while.