Fig. 3
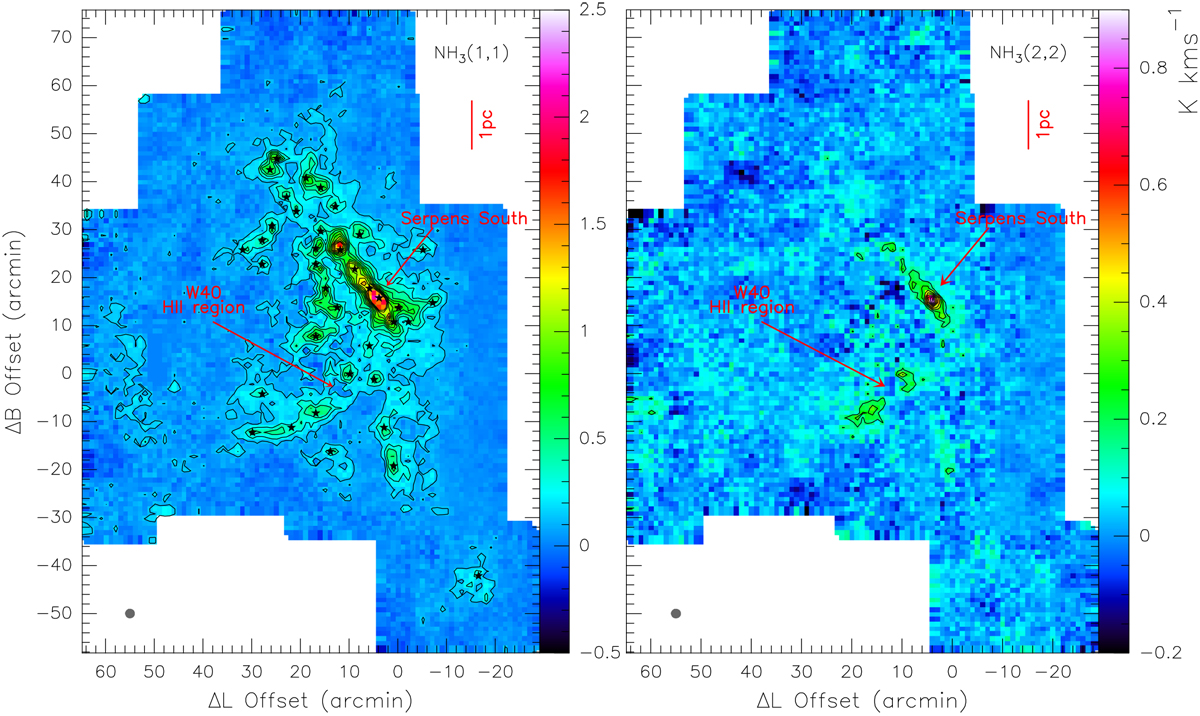
Integrated intensity maps of NH3 (1,1) (left) and (2,2) (right). The reference position is l = 28.59°, b = 3.55°. The integration range is 4 < VLSR < 10 km s−1. Contours start at 0.13 K km s−1 (3σ) on a main beam brightness temperature scale and go up in steps of 0.13 K km s−1. The unit of the color bars is K km s−1. The half-power beam width is illustrated as a black filled circle in the lower left corners of the images. The red line in the top right of each map illustrates the 1 pc scale at a distance of 436 pc (Ortiz-León et al. 2017, 2018). Left panel: black stars show the positions of the identified 38 ammonia clumps (see Sect. 3.2).
Current usage metrics show cumulative count of Article Views (full-text article views including HTML views, PDF and ePub downloads, according to the available data) and Abstracts Views on Vision4Press platform.
Data correspond to usage on the plateform after 2015. The current usage metrics is available 48-96 hours after online publication and is updated daily on week days.
Initial download of the metrics may take a while.