Fig. 2
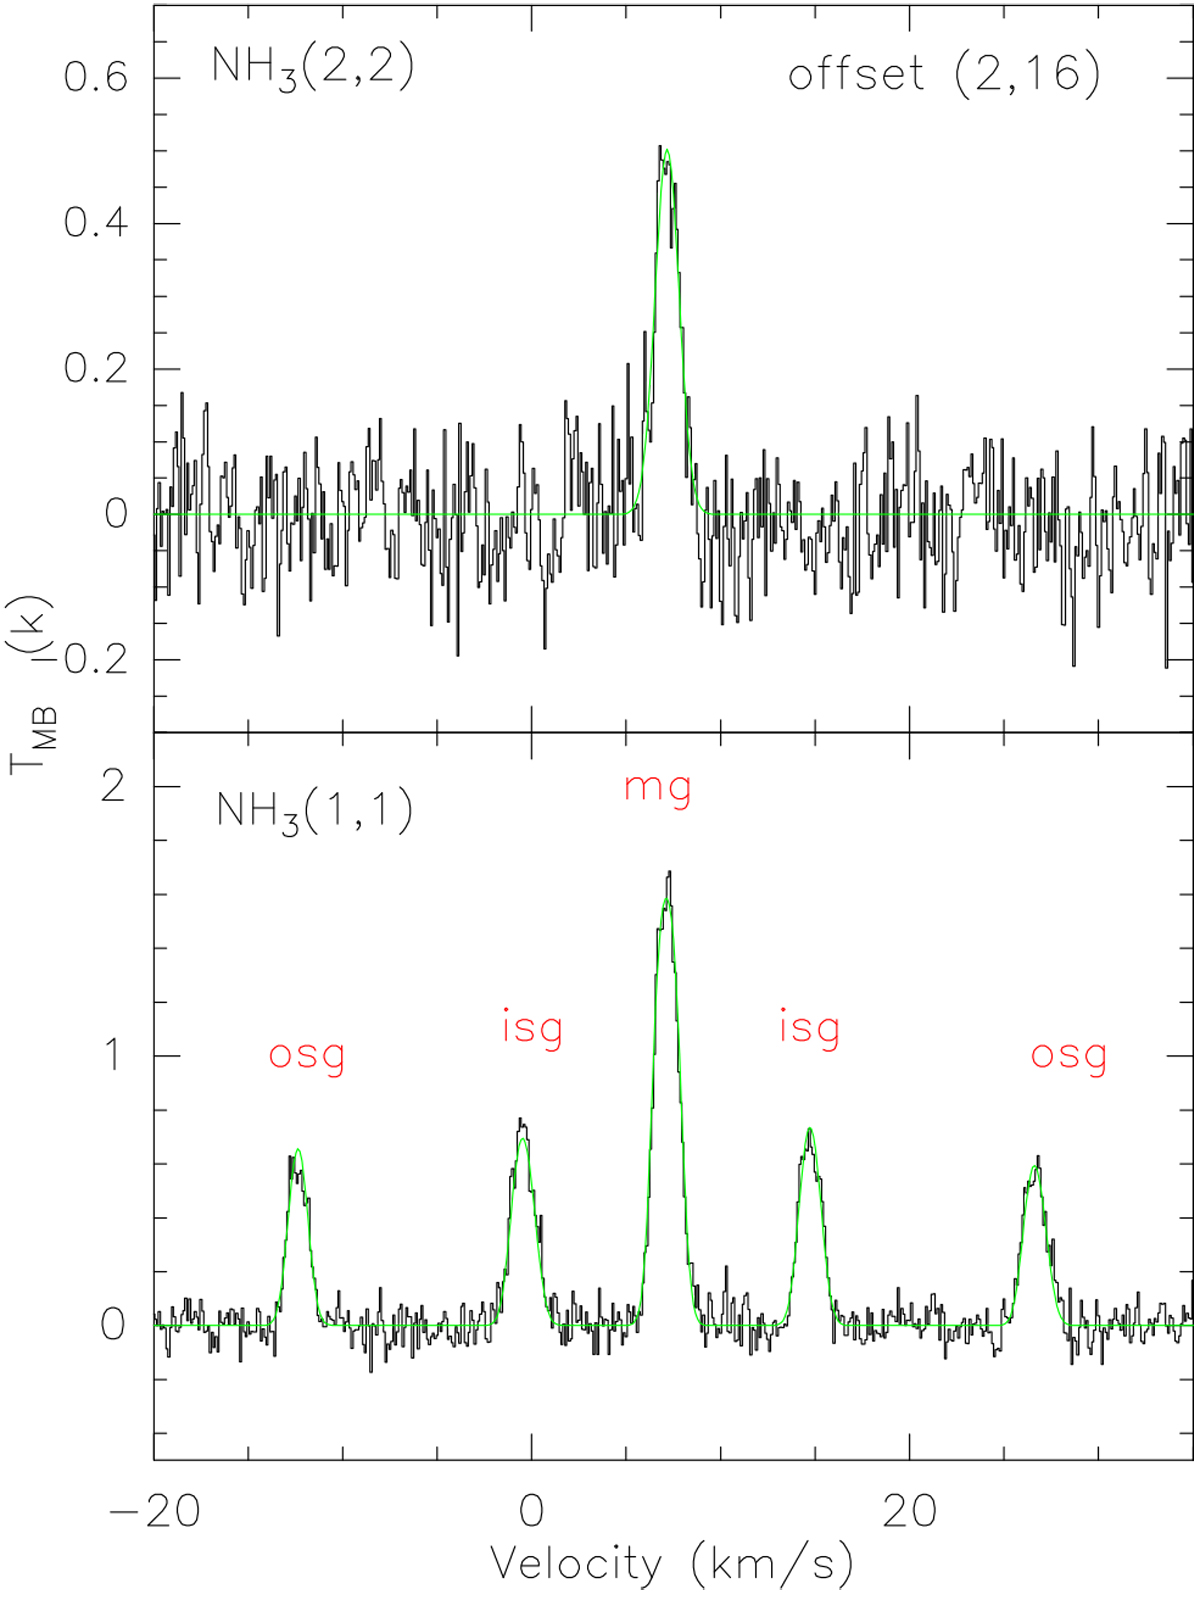
NH3 (1,1) and (2,2) spectra at offset (Δl, Δb) = (2′, 16′) with respect to the reference position (l = 28.59°, b = 3.55°). In each panel, the black solid line represents the observed spectrum, the green solid line indicates the NH3 (1,1) fitting (lower panel) and Gaussian fitting (upper panel) of the NH3 (2,2) line (see Sect. 2.2). The groups of hyperfine components “mg”, “isg”, and “osg” represent the main, inner-satellite, and outer-satellite groups. The velocity scale is Local Standard of Rest, here and elsewhere.
Current usage metrics show cumulative count of Article Views (full-text article views including HTML views, PDF and ePub downloads, according to the available data) and Abstracts Views on Vision4Press platform.
Data correspond to usage on the plateform after 2015. The current usage metrics is available 48-96 hours after online publication and is updated daily on week days.
Initial download of the metrics may take a while.