Fig. 10
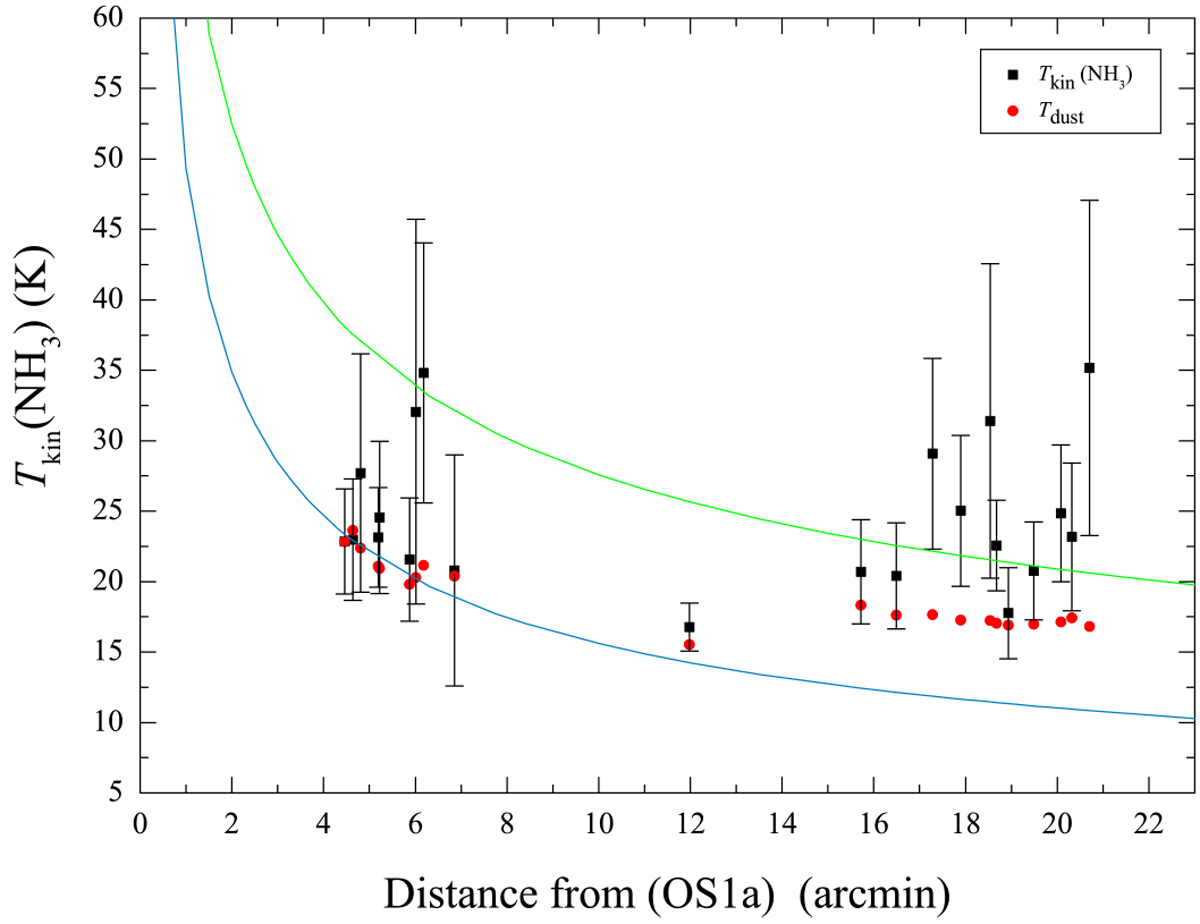
Gas kinetic temperature derived from para-NH3 (black points) and dust temperature (red points) along the W 40 region (projected distance from its main stellar source OS1a, l = 28.79°, b = 3.49°). The blue and green lines are the expected relationships from a Stefan-Boltzmann law and modified Stefan-Boltzmann law (see Sect. 4.4), respectively, assuming OS1a is the dominant source with an approximate luminosity of 105.25 L⊙ (Kuhn et al. 2010; Rumble et al. 2016).
Current usage metrics show cumulative count of Article Views (full-text article views including HTML views, PDF and ePub downloads, according to the available data) and Abstracts Views on Vision4Press platform.
Data correspond to usage on the plateform after 2015. The current usage metrics is available 48-96 hours after online publication and is updated daily on week days.
Initial download of the metrics may take a while.