Free Access
Fig. 1
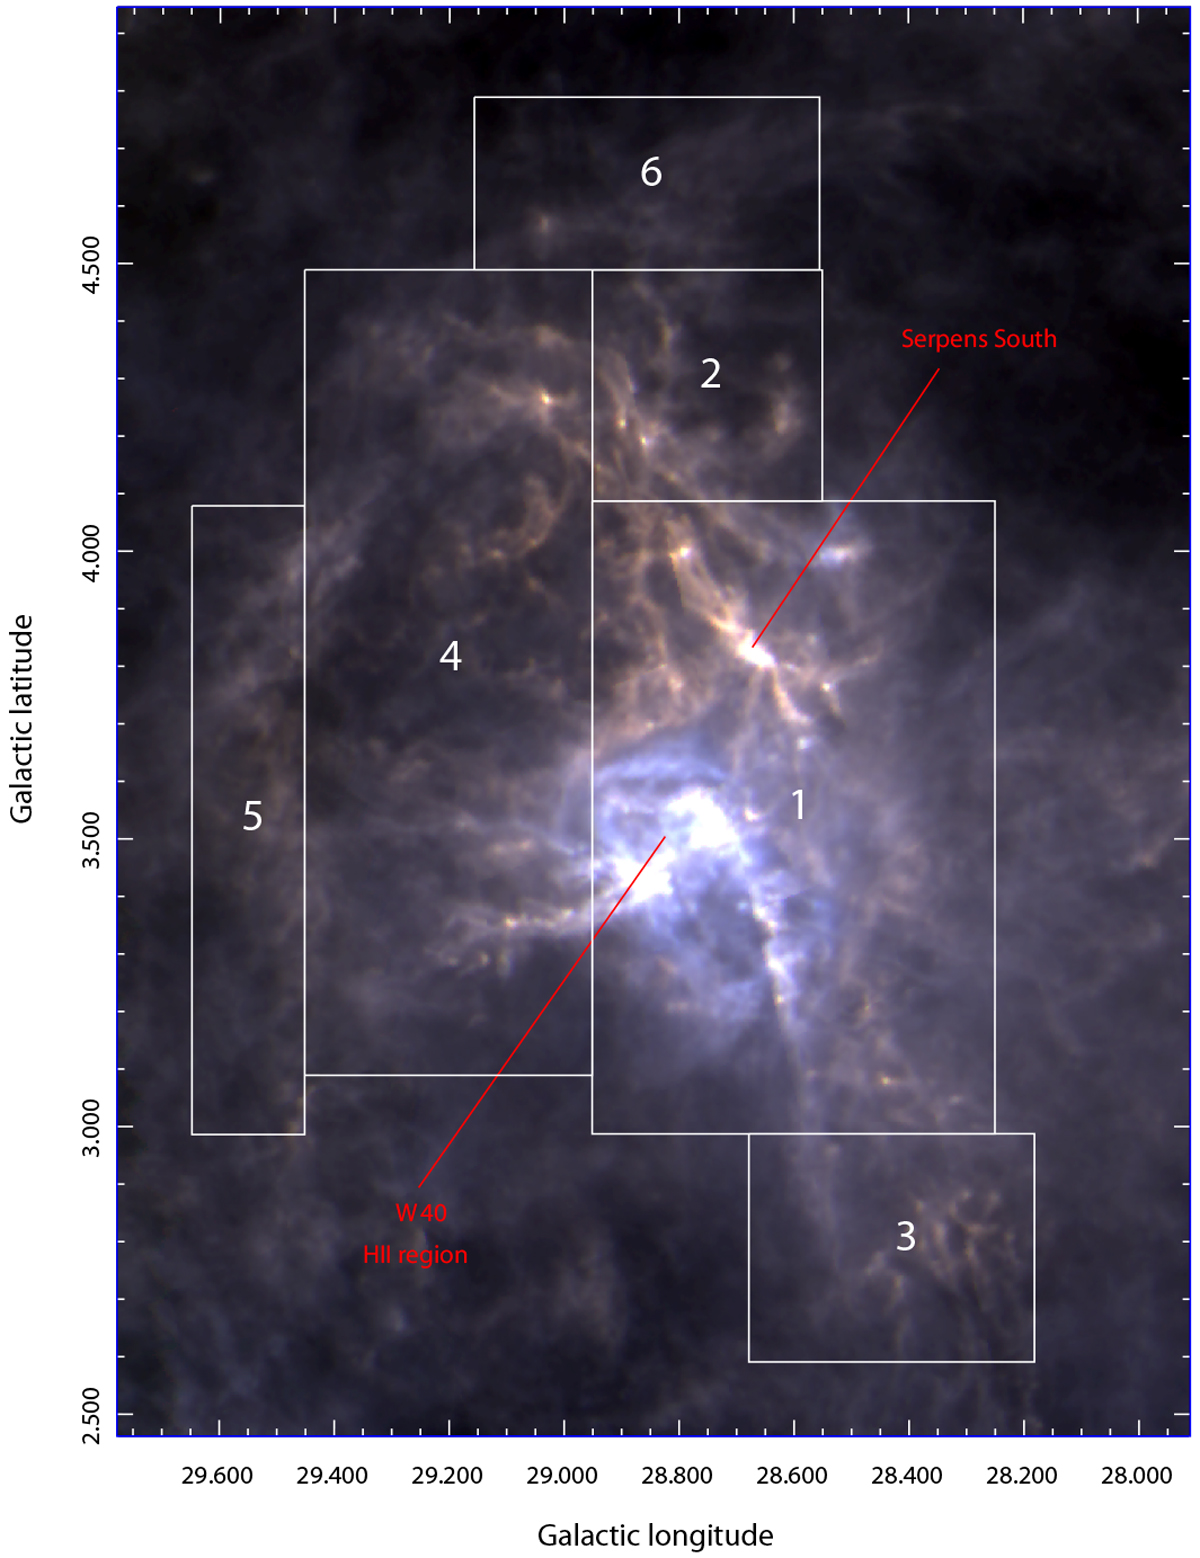
Color image of the Aquila Rift (red for 500 μm, green for 350 μm, and blue for 250 μm, all derived from Herschel data; Bontemps et al. 2010; Könyves et al. 2010). The regions subsequently observed in NH3 are marked by six boxes (see Table A.1).
Current usage metrics show cumulative count of Article Views (full-text article views including HTML views, PDF and ePub downloads, according to the available data) and Abstracts Views on Vision4Press platform.
Data correspond to usage on the plateform after 2015. The current usage metrics is available 48-96 hours after online publication and is updated daily on week days.
Initial download of the metrics may take a while.