Fig. 6.
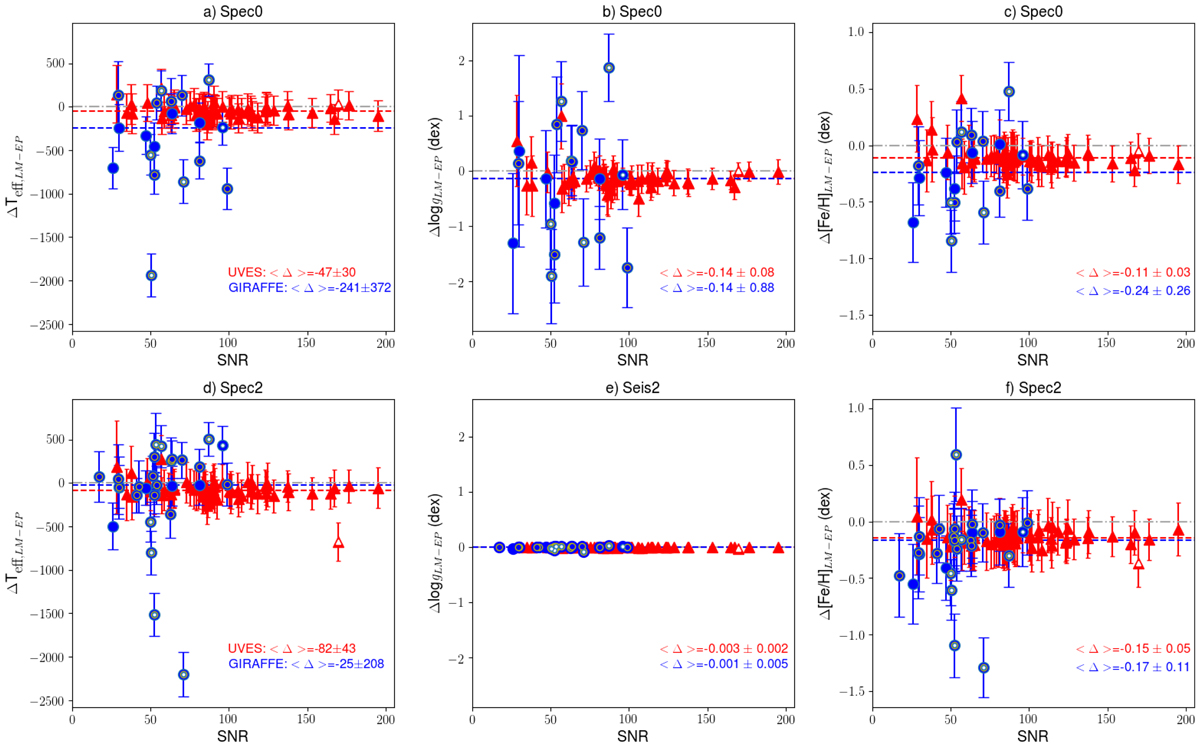
Comparison between the EPINARBO and Lumba parameters against signal-to-noise (S/N) determined for Spec0 in the top row and Spec2 in the bottom row. Left to right: the panels compare spectroscopic Teff, spectrocopic/seismic log g, and spectroscopic [Fe/H], in turn, for UVES (red) and GIRAFFE (blue) spectra. Yellow circles are stars rejected by EPINARBO for inconsistent Fe I and Fe II abundances in Spec0. Central white circles (GIRAFFE) or white triangle (UVES) are stars rejected by EPINARBO for inconsistent Fe I and Fe II abundances in Spec2. The median and MAD of the difference is given for each.
Current usage metrics show cumulative count of Article Views (full-text article views including HTML views, PDF and ePub downloads, according to the available data) and Abstracts Views on Vision4Press platform.
Data correspond to usage on the plateform after 2015. The current usage metrics is available 48-96 hours after online publication and is updated daily on week days.
Initial download of the metrics may take a while.