Fig. 14.
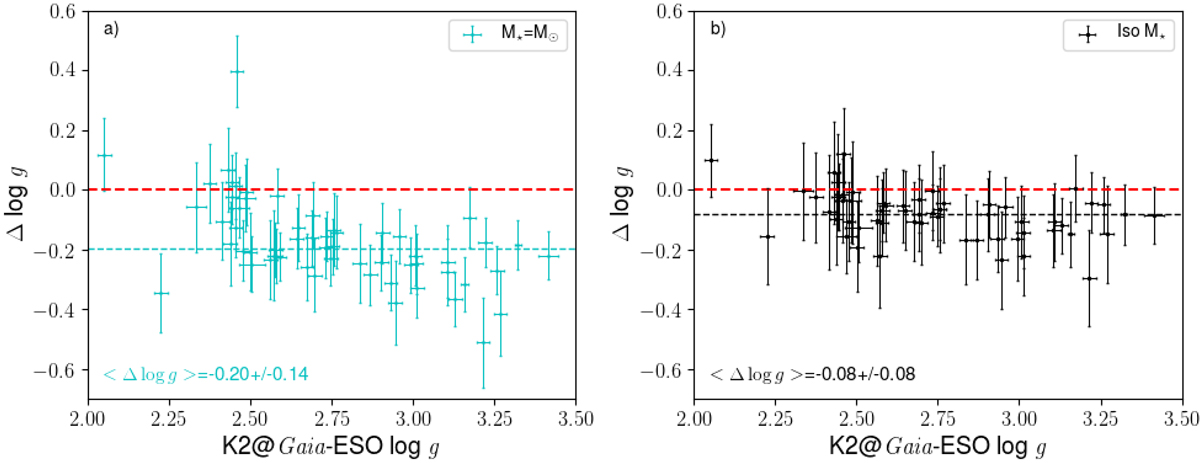
Comparison of log g determined using Gaia parallax with the final K2@Gaia-ESO seismic log g. Cyan points are derived from an initial mass equal to solar, black points are derived from masses based on isochrones. The dashed red line shows the zero difference and the dotted black and cyan lines shows the mean of the differences respectively.
Current usage metrics show cumulative count of Article Views (full-text article views including HTML views, PDF and ePub downloads, according to the available data) and Abstracts Views on Vision4Press platform.
Data correspond to usage on the plateform after 2015. The current usage metrics is available 48-96 hours after online publication and is updated daily on week days.
Initial download of the metrics may take a while.