Fig. 6.
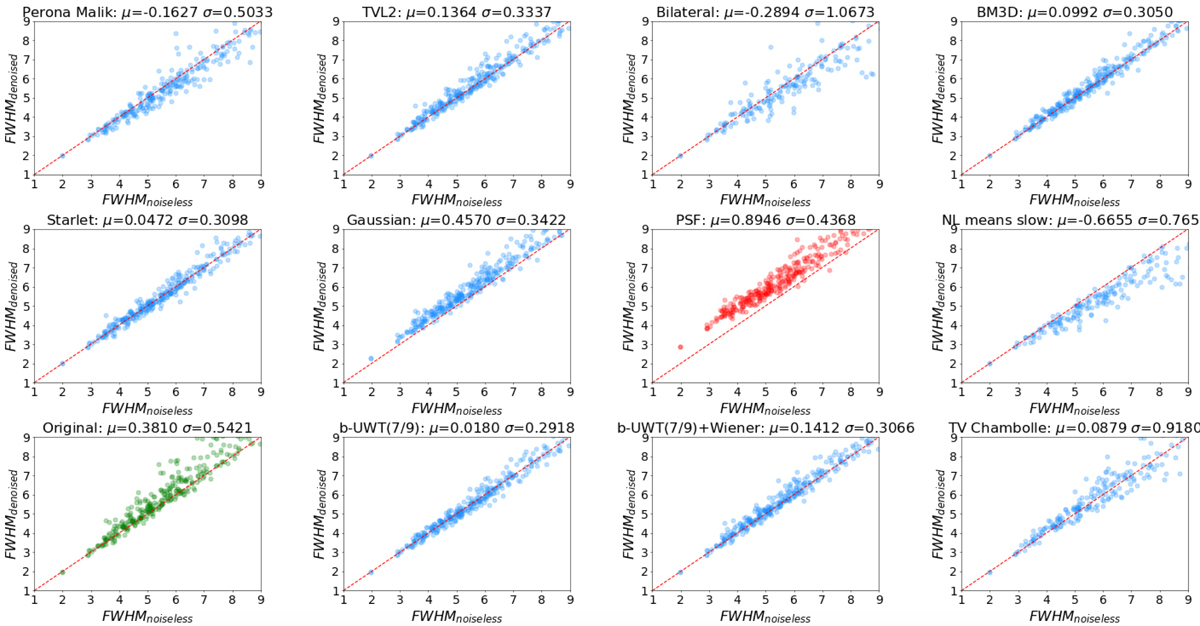
Step 4: FWHM conservation test on galaxies. On the x-axis we plot the FWHM of the objects measured on Noiseless image FWHMnoiseless, whereas on the y-axis we plot the FWHM measured on the original image after the application of the denoising algorithms FWHMdenoised. μ and σ are the mean and the standard deviation of the distribution of FWHMdenoised − FWHMnoiseless.
Current usage metrics show cumulative count of Article Views (full-text article views including HTML views, PDF and ePub downloads, according to the available data) and Abstracts Views on Vision4Press platform.
Data correspond to usage on the plateform after 2015. The current usage metrics is available 48-96 hours after online publication and is updated daily on week days.
Initial download of the metrics may take a while.