Fig. 4.
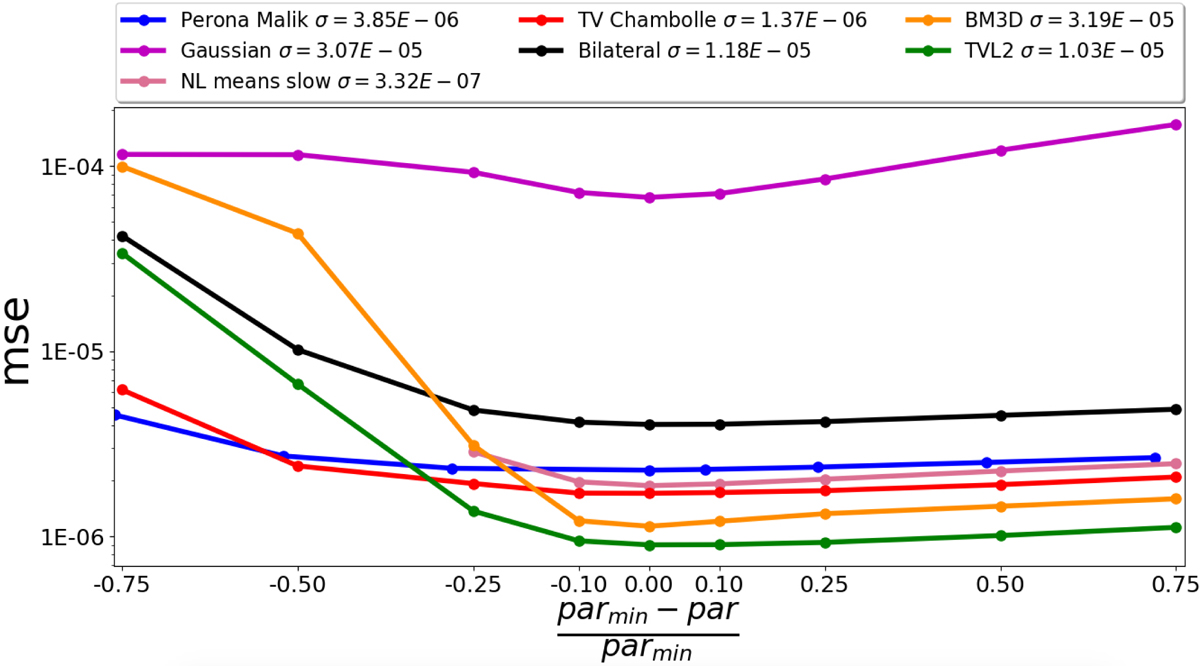
Step 3: Stability against variations of the parameters. Each curve corresponds to a denoising algorithm. We plot the MSE against the relative variation of the parameters, ![]() . Obviously the absolute minimum of the curves is reached in 0 on the x-axis, corresponding to the ideal value of the parameter. In the upper panel we report the standard deviations σ of the msemean − mse distribution for each method.
. Obviously the absolute minimum of the curves is reached in 0 on the x-axis, corresponding to the ideal value of the parameter. In the upper panel we report the standard deviations σ of the msemean − mse distribution for each method.
Current usage metrics show cumulative count of Article Views (full-text article views including HTML views, PDF and ePub downloads, according to the available data) and Abstracts Views on Vision4Press platform.
Data correspond to usage on the plateform after 2015. The current usage metrics is available 48-96 hours after online publication and is updated daily on week days.
Initial download of the metrics may take a while.