Free Access
Fig. C.4.
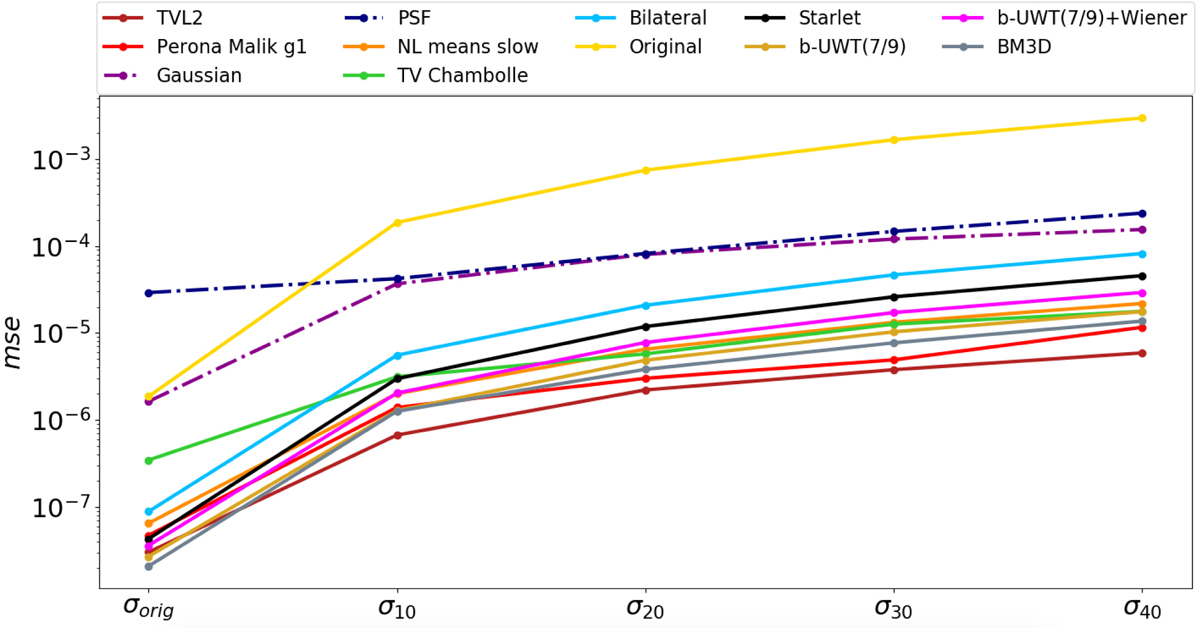
H160 depth variation comparison plot. On the x-axis the H160 images with Gaussian noise standard deviation equal to 1, 10, 20, 30, and 40 times the original value, whereas on the y-axis mse.
Current usage metrics show cumulative count of Article Views (full-text article views including HTML views, PDF and ePub downloads, according to the available data) and Abstracts Views on Vision4Press platform.
Data correspond to usage on the plateform after 2015. The current usage metrics is available 48-96 hours after online publication and is updated daily on week days.
Initial download of the metrics may take a while.