Fig. 11.
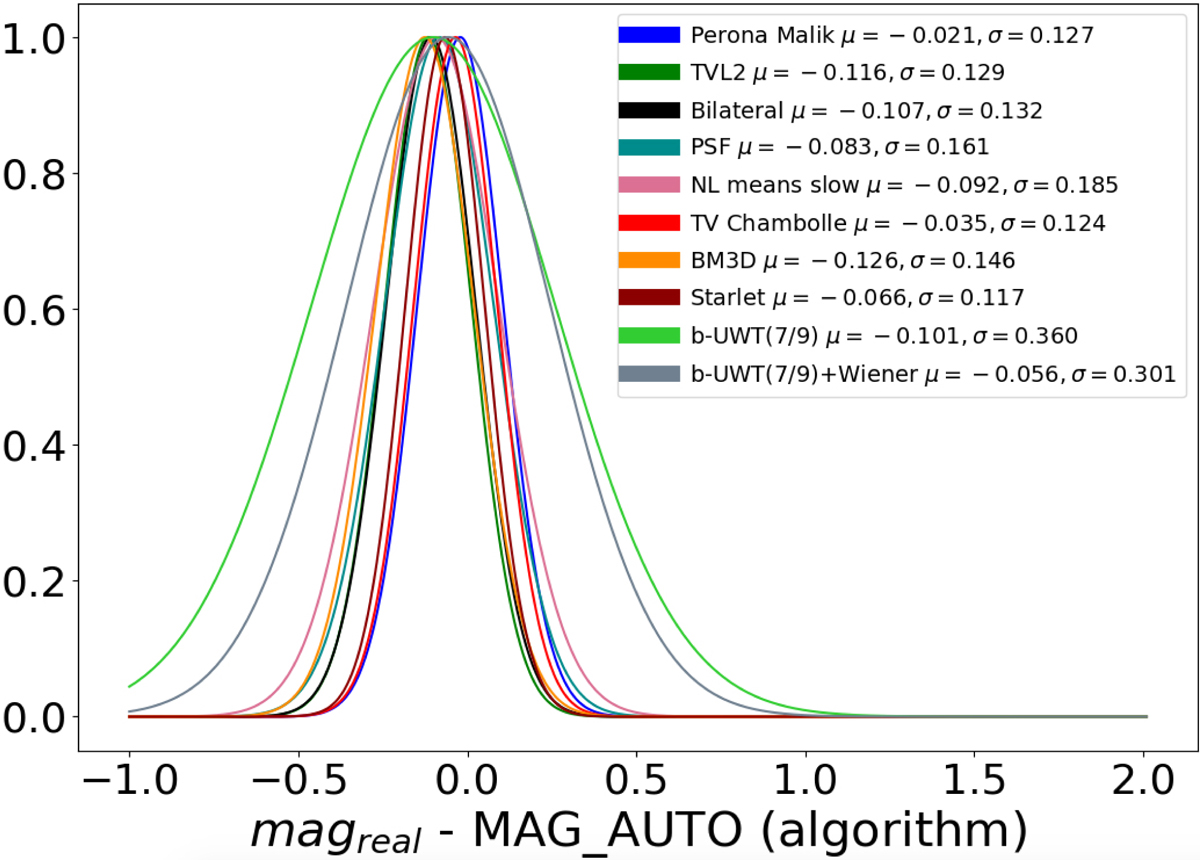
Step 6: Flux conservation distribution for objects with magnitude within 19 and 23. On the x-axis, the difference between the magnitude measured MAG_AUTO and the real objects magnitude from the catalog (magreal). On the y-axis the MAG_AUTO – magreal probability distribution function. Only the detected objects within the purity and completeness thresholds (Sect. 5.7) are considered. μ and σ are the distribution mean and the standard deviation values.
Current usage metrics show cumulative count of Article Views (full-text article views including HTML views, PDF and ePub downloads, according to the available data) and Abstracts Views on Vision4Press platform.
Data correspond to usage on the plateform after 2015. The current usage metrics is available 48-96 hours after online publication and is updated daily on week days.
Initial download of the metrics may take a while.